If you click the “Run” button at the bottom of the GUI window, the Introspect ESP
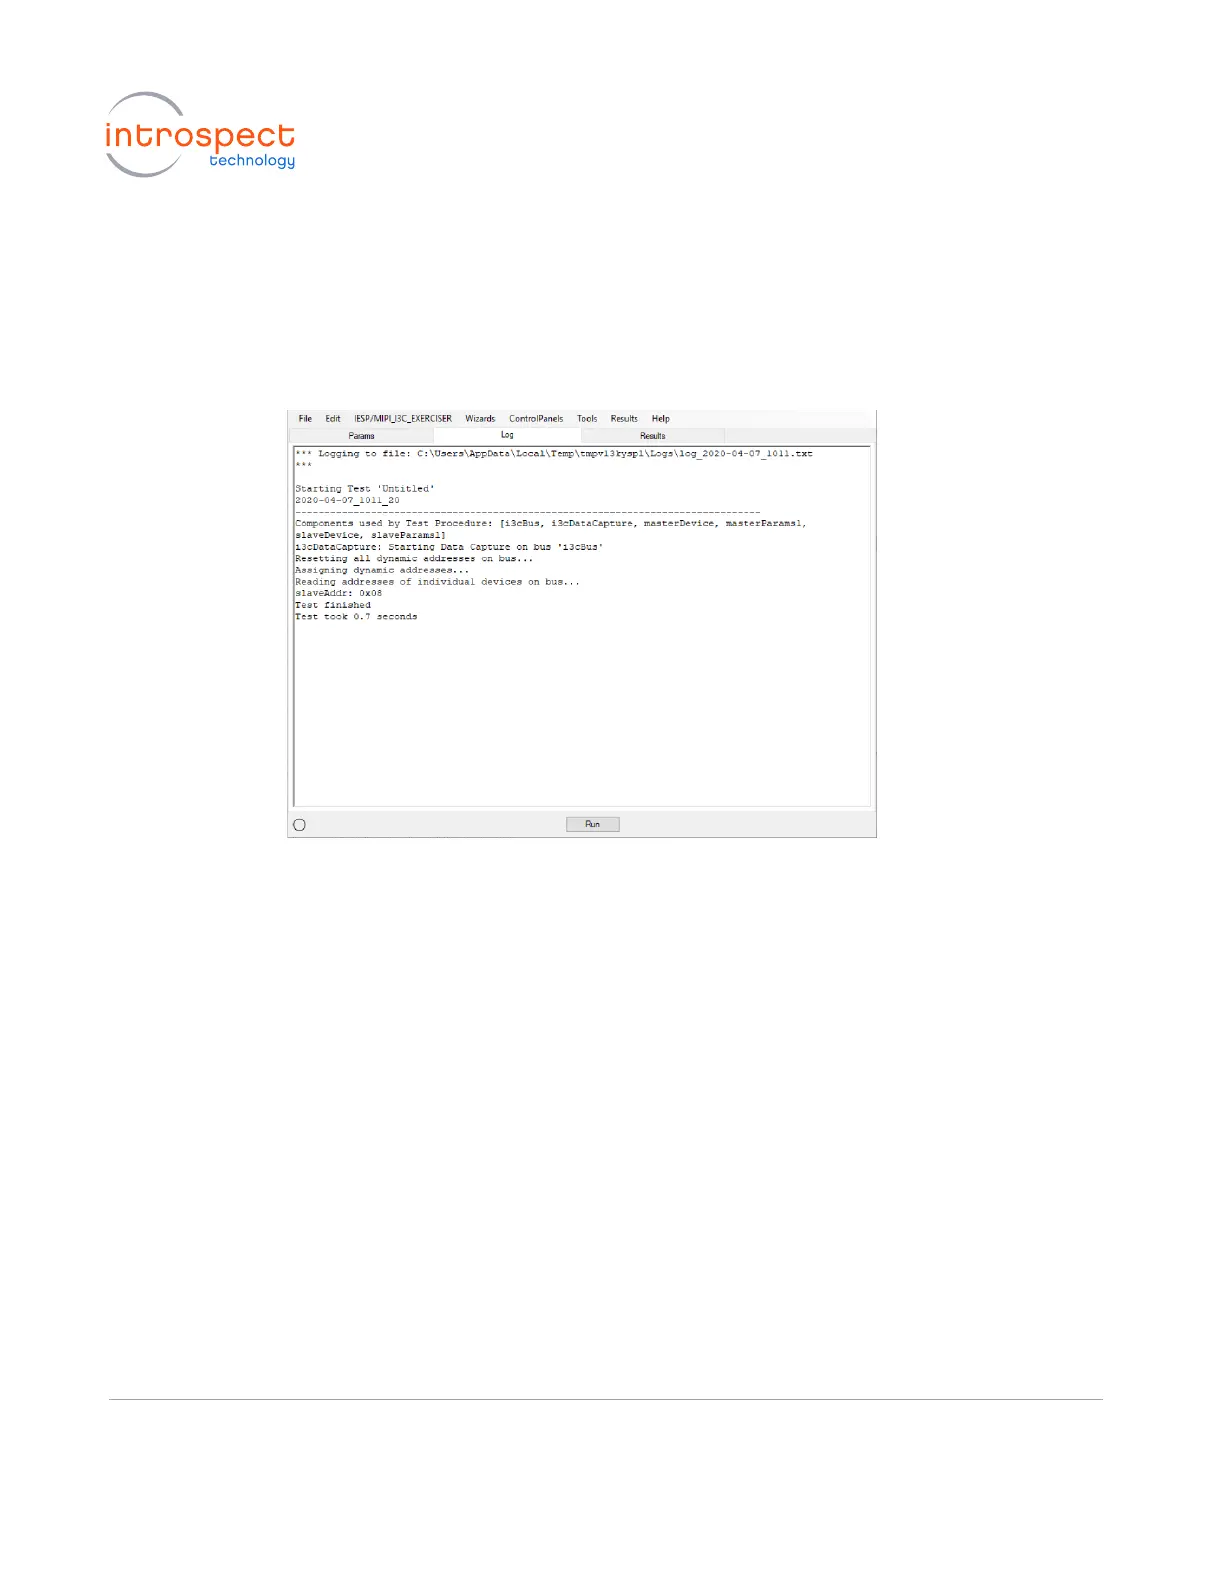
Software will execute the script. Switch to the “Log” tab, where you will see the
messages from your test procedure, as shown in the image below. As seen below,
the slave device was assigned address 0x08.
c) Since you have previously enabled the data capture component, you can visualize
the I3C commands sent to the slave device to assign a dynamic address to it. To do
so, navigate to the “Results” tab at the top of the GUI window, select the most recent
run result and double click the “i3cDataCapture1” data capture icon. The data
capture viewer is divided in three tabs: “PHY”, “I3C States” and “Messages” and will
allow you to see and visualize all of the bus activity.
d) The “PHY” tab shows the different physical states of the I3C bus during the run. A
new entry will be added to this tab every time the I3C bus changes state. Note that
you can visualize the waveform over several PHY states by selecting a start PHY state,
pressing and holding the CTRL key on your keyboard, and selecting a second end
PHY state, as shown in the image on the following page.
 Loading...