5: APPENDICES
Iridium Pilot™ Installation Guide 61
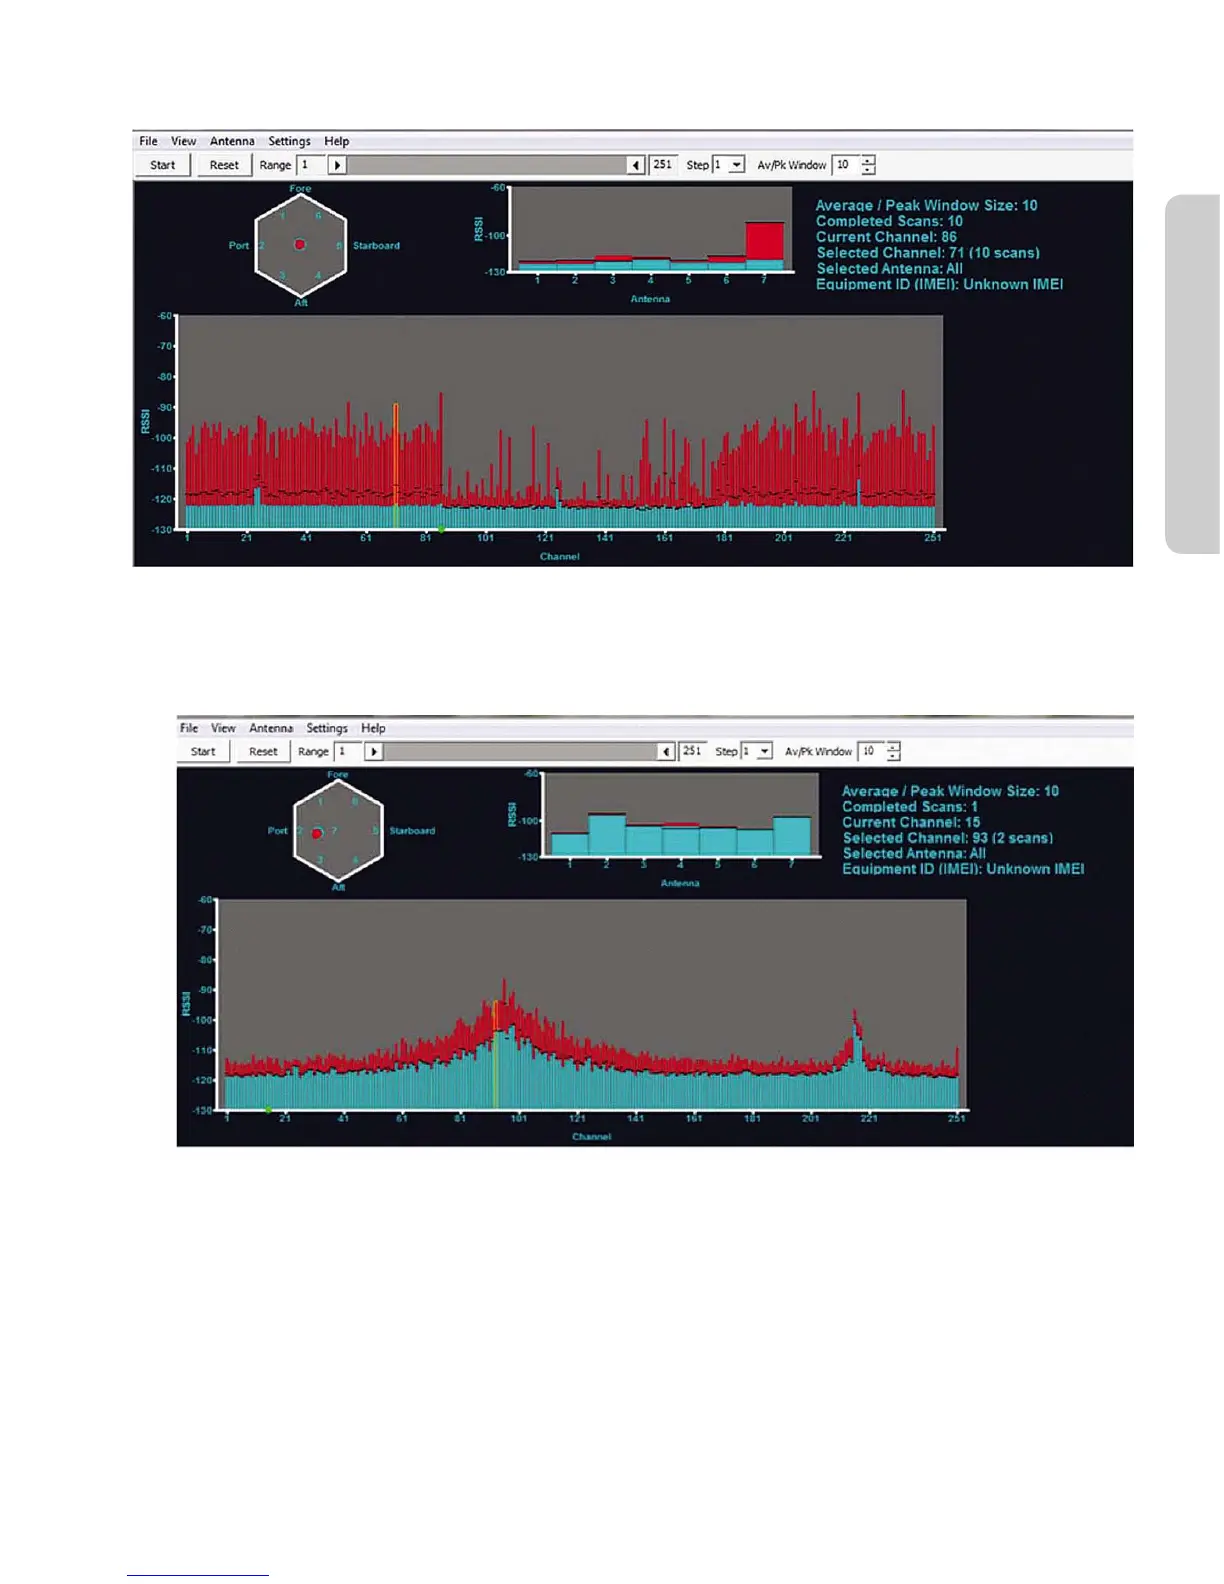
Figure 24.
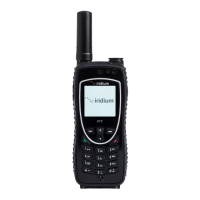
This next example shows noise from a nearby personal computer. This signature is typical with a pyramid type
response peaking at channel 100 and the overall noise oor elevated above -120 dBm.
Figure 25.
The nal plot simulates how RADAR might appear on a site survey. A denite periodic structure can be seen
with peaks and valley repeating every 10 channels (or about every 3.5 seconds since the channels area
sampled once every 0.35 seconds) this repetition is most likely the RADAR antenna rotation rate and will
change as the radar sweep changes. The larger two valleys located at channels 50 and 190 are more a function
of the RADAR PRF (pulse repetition frequency) and pulse width. Actual RADAR interference may look quite
dierent from this example but the elevated noise oor will cause the ADE to function poorly or not at all.
Switching the suspected RADAR to “standby” will return the noise oor to below -120 dBm if this is the actual
cause of the interference.



 To Next Page