18
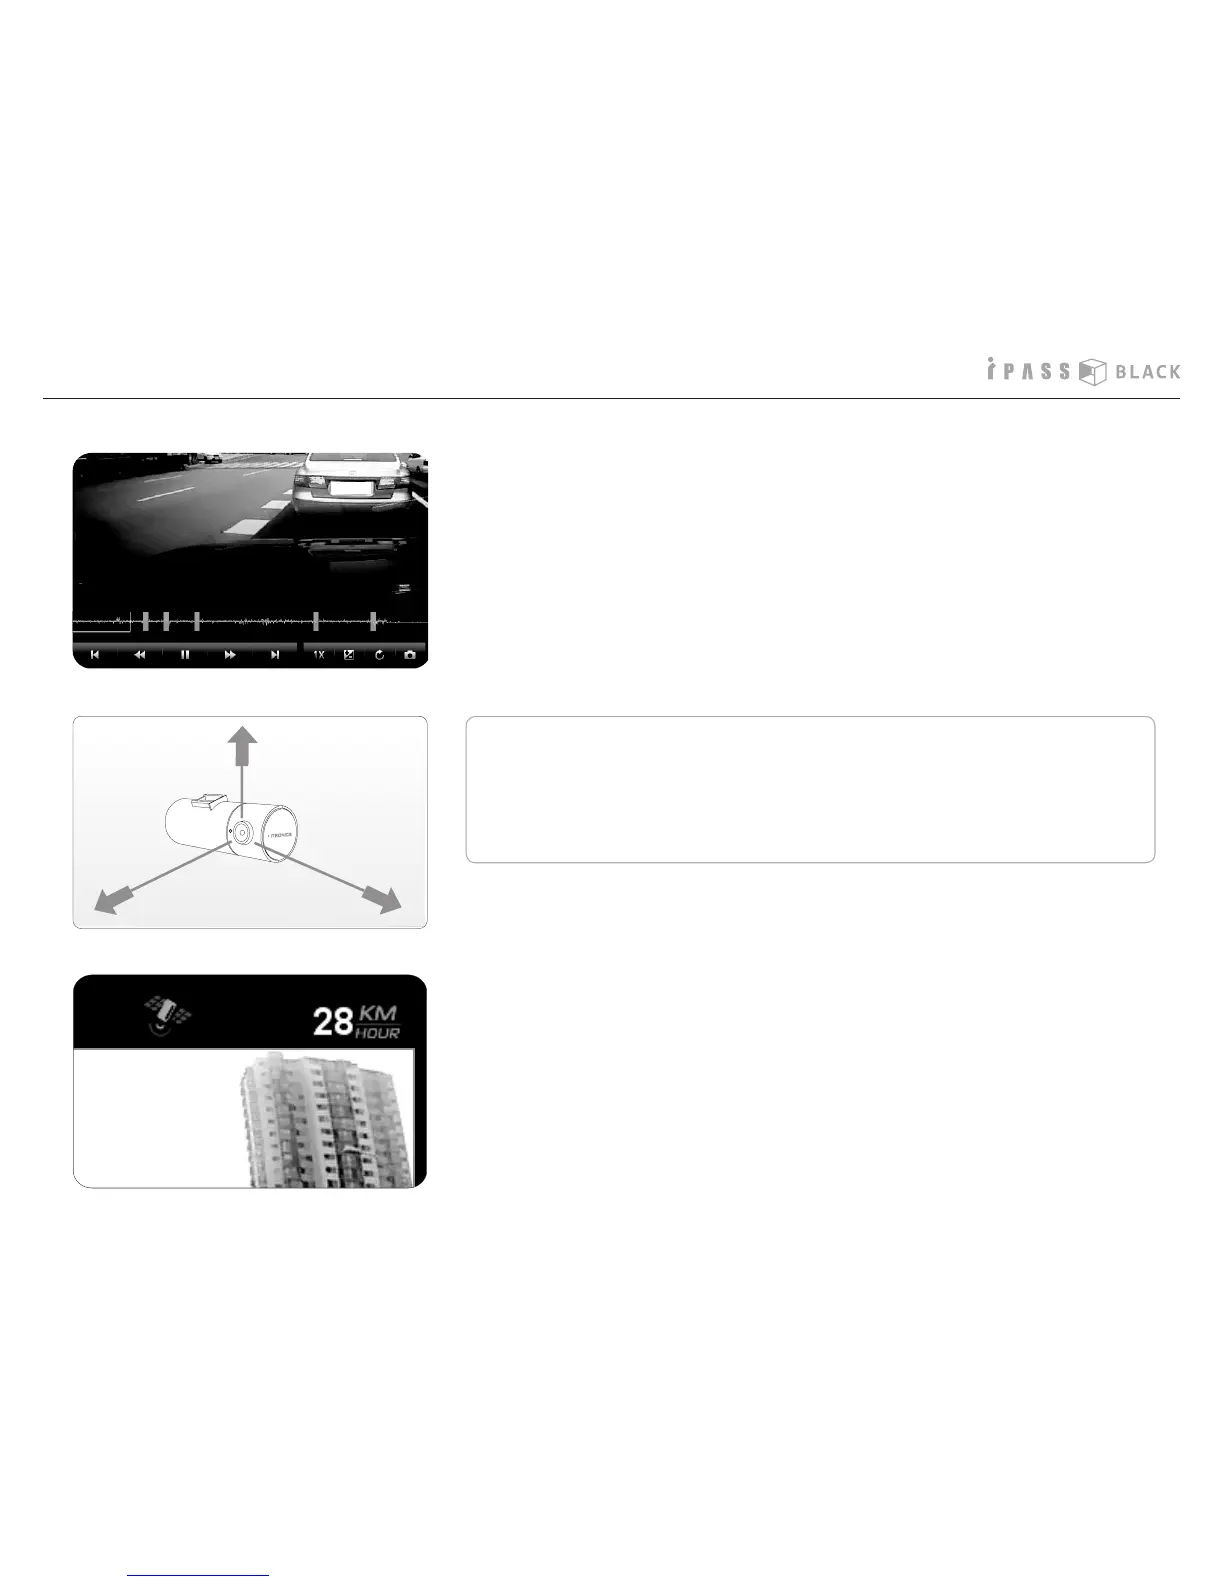
How to play the Video
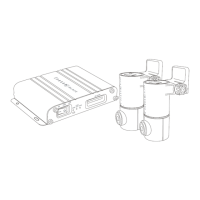
7. The graph shown under the playback screen means the degree of
X axis ( front and back), Y axis (left and right), and Z axis ( up and
down) impacts when an event occurs.
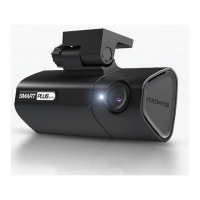
8. The driving speed and GPS status displays on the top of the playback
screen. (ITB-70G only)
※
If the level of impact is so light even in the case of an accident, the
impact senor may not recognize it and fails to sort out the data as
event le automatically. In this case, press the event button manu-
ally.