For Your Safe Flight ............................................. Page 21
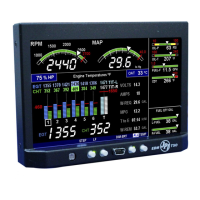
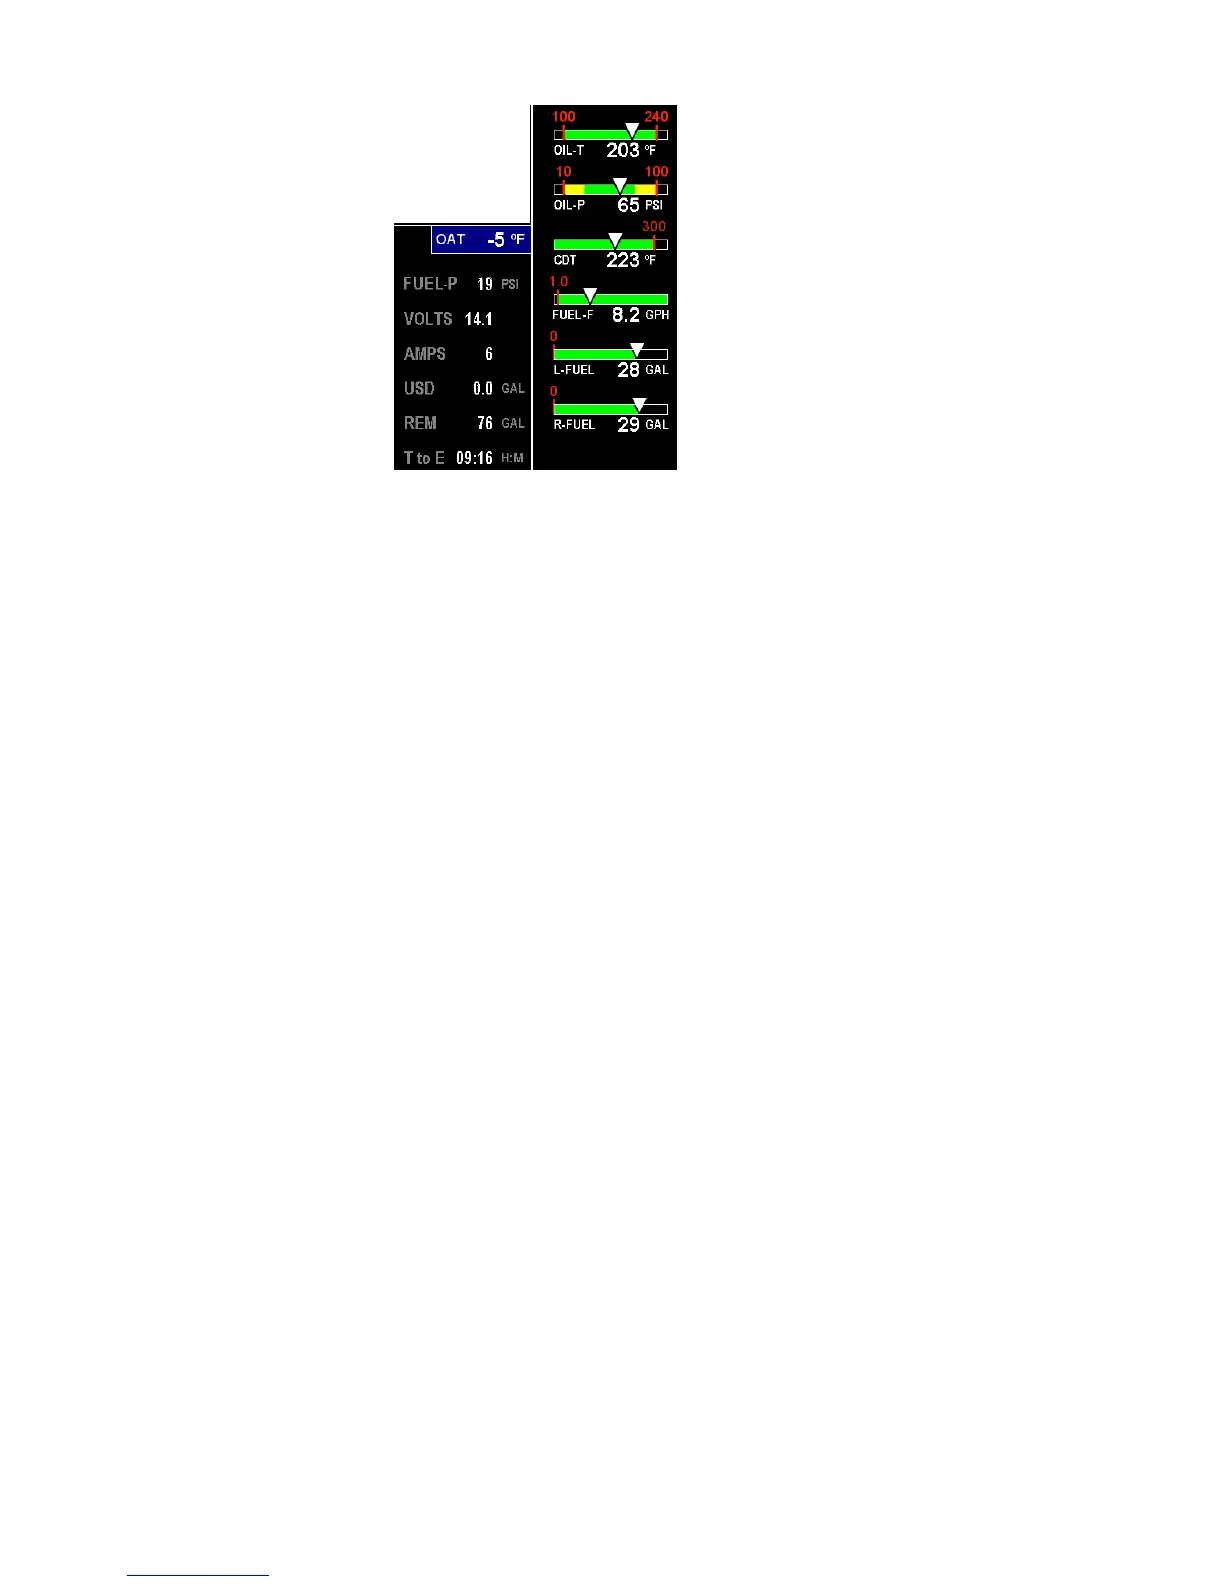
Linear Bar Graph Displays
The linear bar graphs are
arranged on the right half of the
display. A typical layout is
depicted here (Note: your actual
configuration may vary). Typical
functions that can be displayed
are:
Primary gauges
Oil temperature
Oil pressure
Compressor Discharge
temp
Fuel Flow.
Left tank fuel quantity
Right tank fuel quantity
Non Primary gauges
Fuel pressure
Volts
Amps
Fuel USED Estimated
Fuel REM Estimated
Time to Empty Estimated
Outside Air Tem.
The range of the bar graphs depends on the programming. Range,
redlines and/or limits are typically set to match the original aircrafts gauge
markings. The primary and non-primary (advisory) gauge sequences are
configurable using the “Factory Program Mode”. EDM-900 gauge
limitations cannot be user modified.
 Loading...