19
JABRA NOISE GUIDE – MANUAL RETURN TO “ TABLE OF CONTENTS”
MEASUREMENTS DATA
LIVE MEASUREMENT
You can view live measurements in the software by connecting your Jabra Noise Guide directly to your PC.
All data will be saved automatically to the ”Noise Guide Data” folder on the C-drive every 24 hours.
CHART
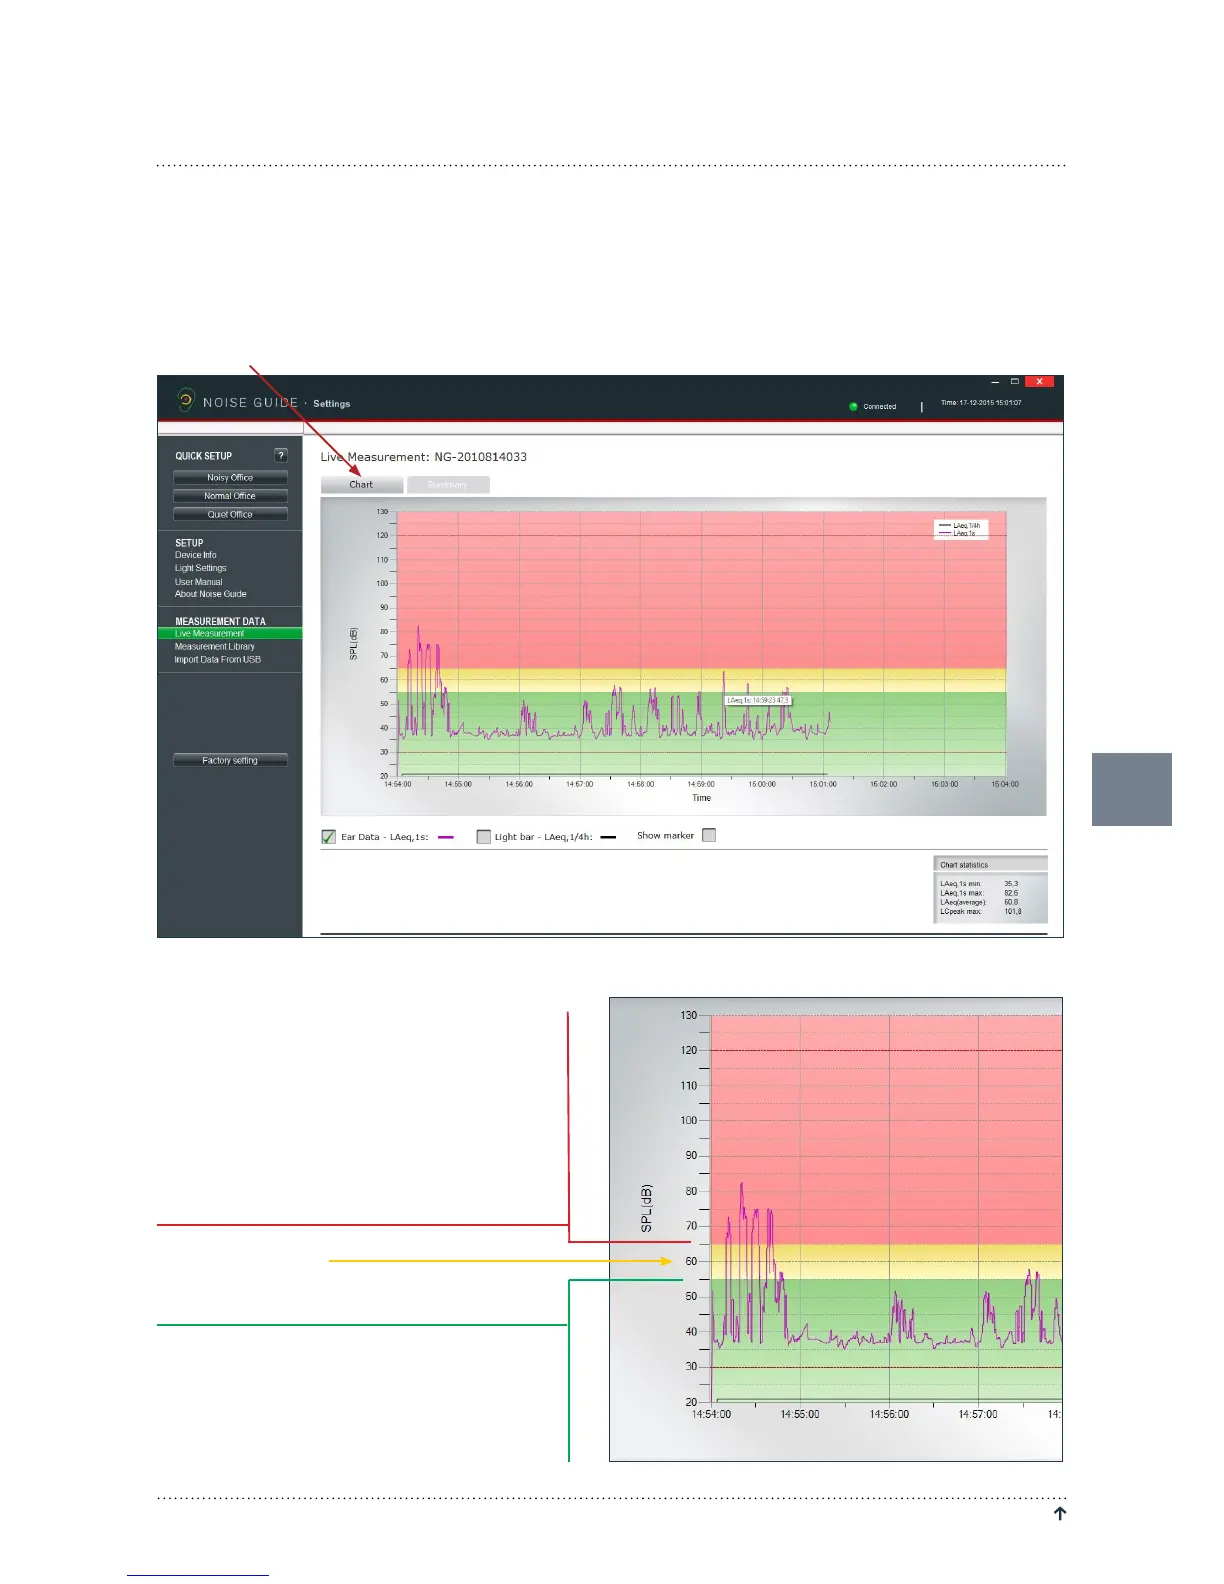
Under ”Live Measurement”, select the left tab ”Chart” to view live measurements in a graph.
The green, yellow and red colour blocks on the
graph visualize the light settings for your Jabra
Noise Guide. The colour blocks will change ac-
cording to your light settings.
Examplel:
In this example the settings are:
Red: 65 dB -120 dB
Yellow: 55 dB – 65 dB
Green: 30 dB – 55 dB
 Loading...
