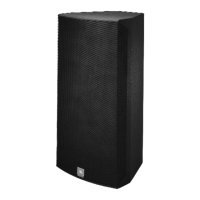
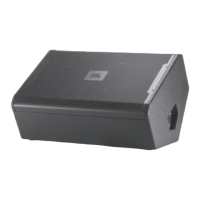
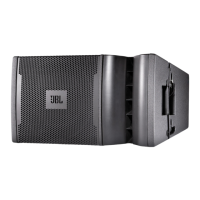
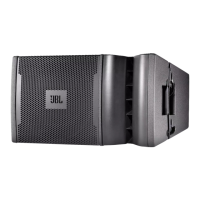
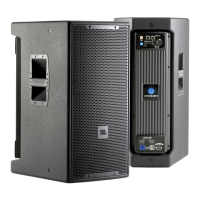
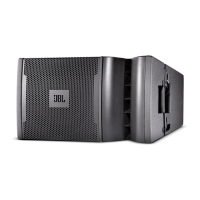
VS3215-9
Three-Way Full Range
Loudspeaker System For
Permanent Installation
Key Features:
䉴 Horn-loaded midrange for 90° x 50°
pattern control to 500 Hz
䉴 SVG (Super Vented Gap Cooled
TM
) LF
transducers
䉴 Trapezoidal enclosure for arraying
䉴 DuraFlex finish, tough, weather resistant
and paintable
䉴 12 Suspension points (M10 Thread)
The model VS3215-9 provides unprece-
dented bandwidth and maximum SPL, all in a
single system package. With nominal 90°
coverage pattern, systems can be splayed
together for increased coverage and/or SPL
requirements. The powerful 15" Super Vented
Gap LF transducer provides powerful bass
with a useable response to 45 Hz. A newly
designed 10" cone midrange driver loads the
waveguide midrange horn, extending pattern
control and giving exceptional clarity and
projection. The proven Optimized Aperture
TM
HF horn completes this unique design.
The VS3215-9 is designed for tri-amplified
use only, utilizing the DSC260 digital
controller for crossover, signal alignment and
equalization functions, provides optimum
system performance.
The VS3215-9 is part of the JBL Venue
Series, a family of modular loudspeaker
systems designed for fixed installation
applications ranging from speech
reinforcement to large scale music
productions. All models are fitted with
suspension points that accept M10 threads.
The enclosures are coated with a hard
wearing, weather resistant, textured finish
DuraFlex. Premium 13 ply wood and an 18
gauge steel, foam backed grille enable the
Venue Series system to comply with
environmental test specifications.
Components:
The VS3215-9 utilizes one of JBL’s finest
cone transducers, the 2227H. The 15" 2227H
is part of JBL’s family of Super Vented Gap
TM
woofers and carries an AES power rating of
600 watts with minimal power compression.
The cone has been treated for weather
resistance.
The 2012H is a new 10" cone driver
designed specifically for loading into the
midrange horn, covering the mid-frequency
range. The transducer is rear loaded with
Thermal Transfer
TM
chamber for maximum
efficiency.
The 38mm (1.5 in) exit 2447J large format
compression driver is coupled to an
Optimized Aperture Bi-Radial
®
horn providing
smooth even coverage. The Optimized
Aperture horn provides lower throat dis-
tortion than its earlier predecessors while ex-
tending frequency response to nearly 20 kHz.
Specifications:
System:
Freq. Range (-10 dB): 35 Hz - 19 kHz
Freq. Response (-3 dB): 50 Hz - 18 kHz
Horz. Coverage Angle (-6 dB): 85° averaged 500 Hz to 16 kHz
Vert. Coverage Angle (-6 dB): 55° averaged 500 Hz to 16 kHz
Directivity Factor (Q): 10.0 averaged 500 Hz to 16 kHz
Directivity Index (DI): 10.0 dB averaged 500 Hz to 16 kHz
Recommended Controller: DSC260
Transducers:
Low Frequency: 2227H, 380 mm (15 in) dia., 100 mm (4 in)
edgewound ribbon voice coil
Nominal Impedance: 8 Ohms
Input Power Rating: 600 W, AES; 2400 W Peak
Sensitivity
1
: 98 dB, 1W @ 1 m (3.3 ft)
Calculated Maximum SPL: 132 dB, @ 1 m (3.3 ft)
Recommended Amplifier
2
: 800 W
Mid-Frequency: 2012H; 254 mm (10 in) dia., 76 mm (3 in)
edgewound ribbon voice coil
Nominal Impedance: 8 Ohms
Input Power Rating: 250 W, AES; 1000 W Peak
Sensitivity
1
: 106 dB, 1 W @ 1 m (3.3 ft)
Calculated Maximum SPL: 136 dB, @ 1 m (3.3 ft)
Recommended Amplifier
2
: 600 W
High-Frequency: 2447J; 100 mm (4") diaphragm and voice coil dia.,
38 mm (1.5") throat dia.
Nominal Impedance: 16 Ohms
Input Power Rating: 75 W, AES; 300 W Peak
Sensitivity
1
: 111 dB, 1 W, @ 1m (3.3 ft)
Calculated Maximum SPL: 136 dB, @ 1 m (3.3 ft)
Recommended Amplifier
2
: 200 W
Physical:
Enclosure: Trapezoidal, 22.5° side angles, birch plywood
Environmental Specifications: Mil-Std 810, IPX4 per IEC 529
Suspension Attachment: 12 points; accepts M10 threaded hardware
Finish: Black DuraFlex coating
Grille: Black powder coated zinc treated 18 gauge
perforated steel grille with foam backing
Input Connectors: 2 x NL8 Neutrik Speakon connectors
Dimensions: 1137 mm x 572 mm x 572 mm (44.75 in x 22.50 in
x 22.50 in)
Net Weight: 74.4 kg (164 lbs.)
1
Measured on-axis in the far field with 1 watt (2.83 V RMS @ 8 ohms or 4.0 V RMS @ 16 ohms) input and referenced to
1 meter distance using the inverse square law. Listed sound pressure represents an average from 300 Hz to 16 kHz.
2
Recommended Amplifier is a power capability value that should be taken as a guide.
JBL continually engages in research related to product improvement. New materials, production methods, and design
refinements are introduced into existing products without notice as a routine expression of that philosophy. For this
reason, any current JBL product may differ in some respect from its published description, but will always equal or
exceed the original design specifications unless otherwise stated.
Venue Series