quirad to make the measurement accurately. Refer to Figure
2-9.
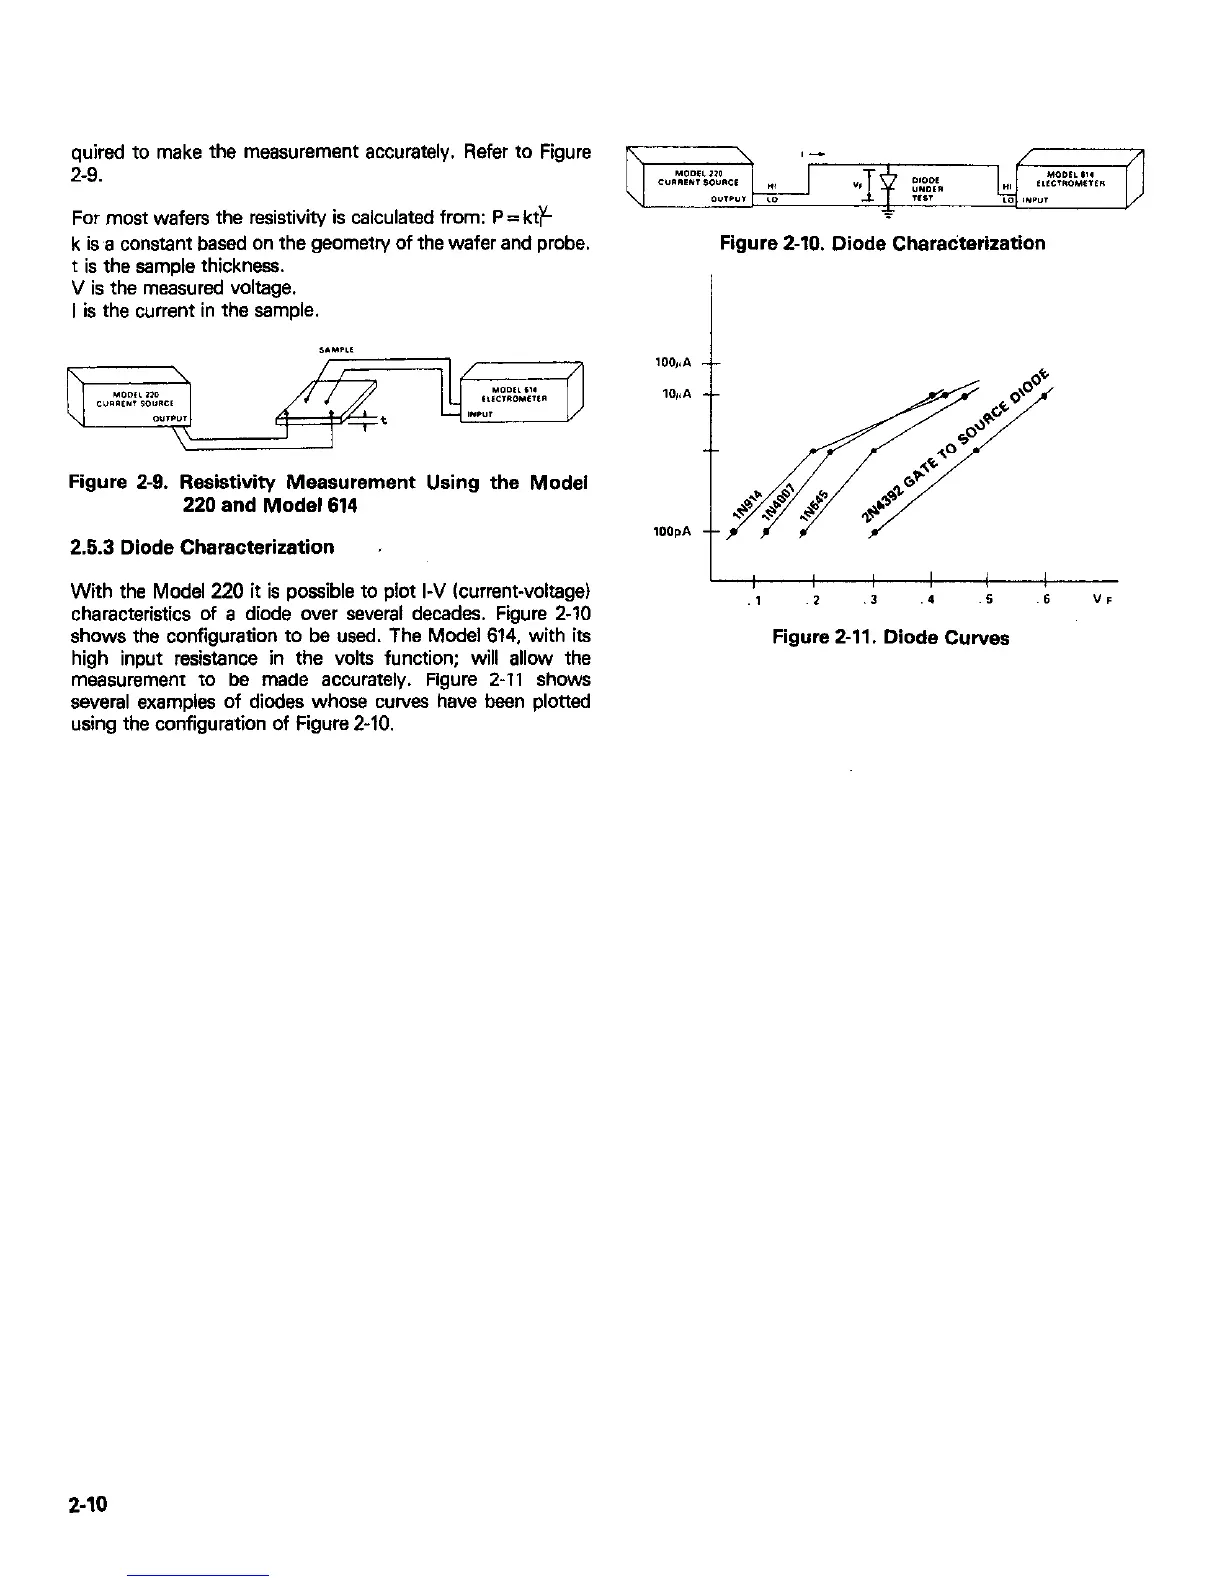
For most wafers the resistivity is calculated from: P = kty
k isa constant based on the geometn/ of the wafer and probe.
t is the sample thickness.
V is the meesurad voltage.
I is the current in the sample.
Figure 2-10. Diode Chsradterization
Figure 2-9. Resistivity Measurement Using the Model
220 and Model 614
2.5.3 Diode Characterization
With the Model 220 it is possible to plot I-V (current-voltage)
characteristics of a diode over several decades. Figure 2-10
shows the configuration to be used. The Model 614, with its
high input resistance in the volts function; will allow the
measurement to be made accurately. Figure 2-11 shows
several examples of diodes whose curves have been plotted
using the configuration of Figure 2-10.
I
I I 1
.I .2
.3
.a 5 5
“F
Figure 2-11. Diode Curves
2-10