150
IQ Analyzer Measurement
Complex Spectrum Measurement
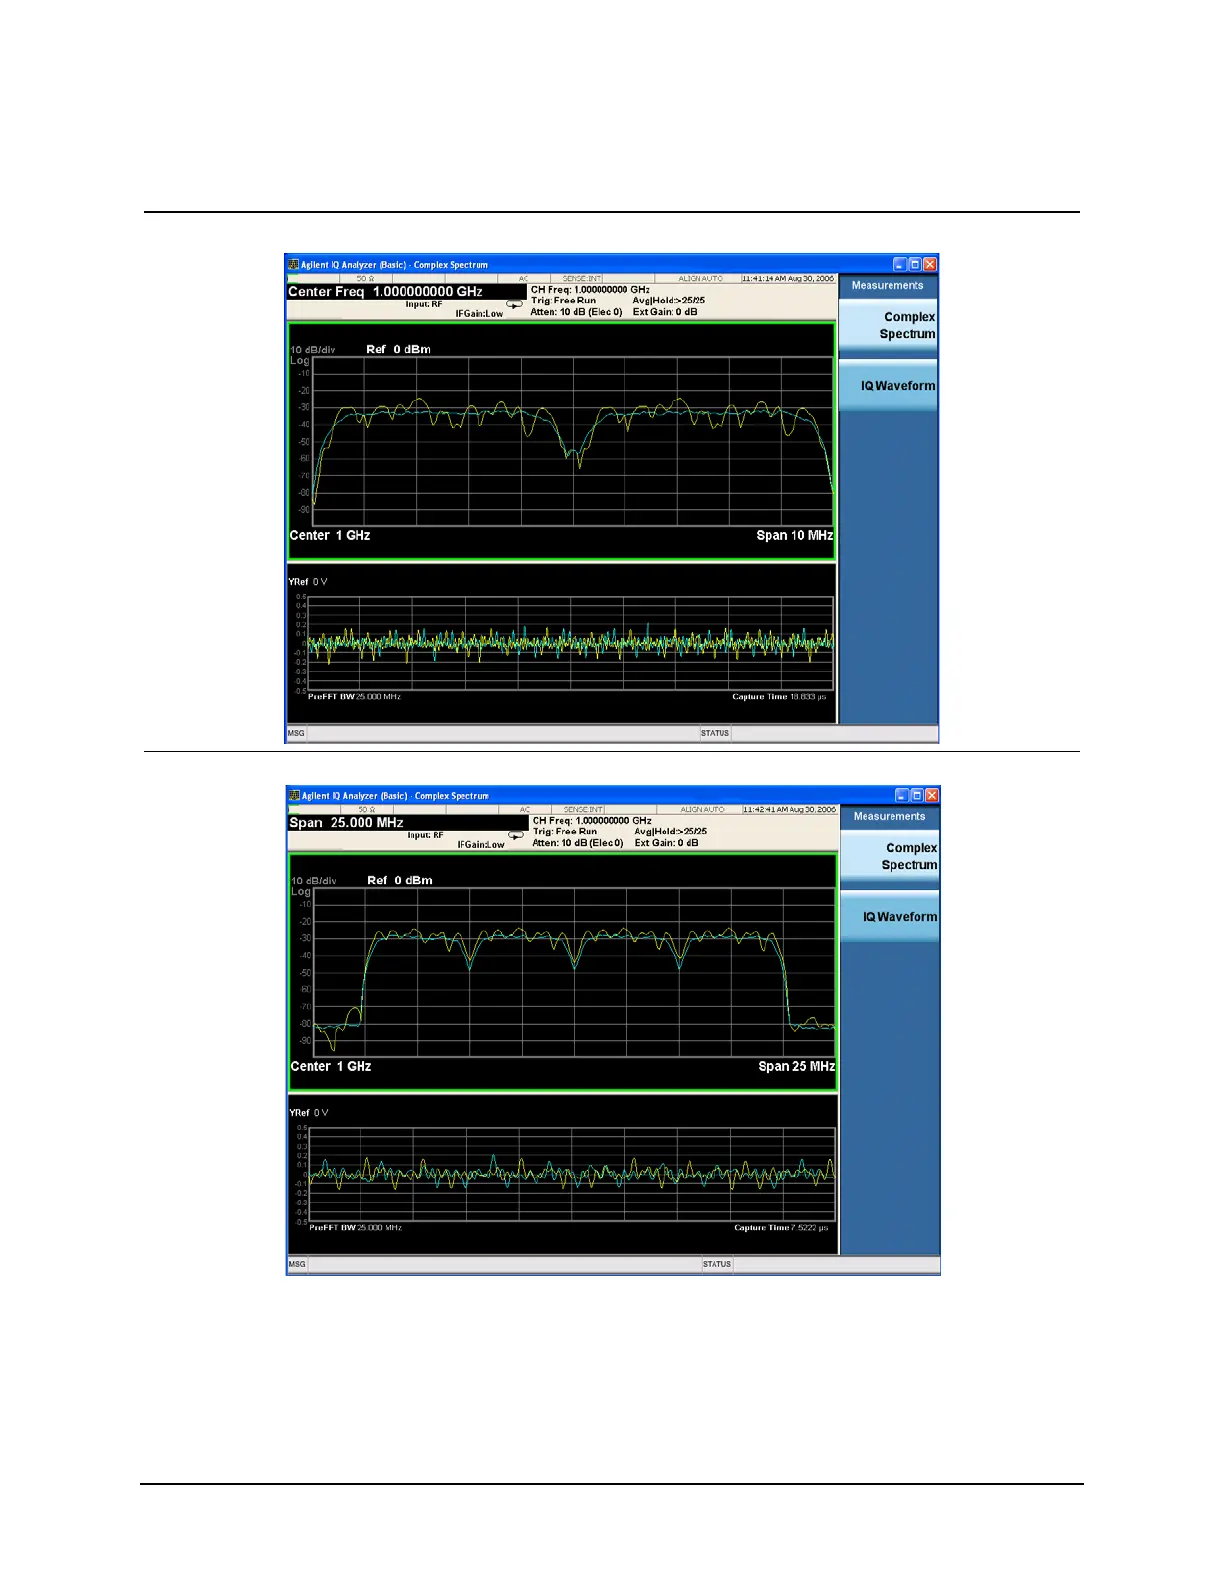
Figure 11-1 Spectrum and I/Q Waveform (Span 10 MHz)
Figure 11-2 Spectrum and I/Q Waveform (Span 25 MHz)
NOTE A display with both an FFT derived spectrum in the upper window and an IQ Waveform in the lower
window will appear when you activate a Complex Spectrum measurement. The active window is
outlined in green. Changes to Frequency, Span or Amplitude will affect only the active window. Use
the Next Window key to select a different window, and Zoom key to enlarge the window.
Step Action Notes

 Loading...