K71000 Automatic PMCC Flash Point Analyzer
Operation and Instruction Manual
K71000-Manual -23-
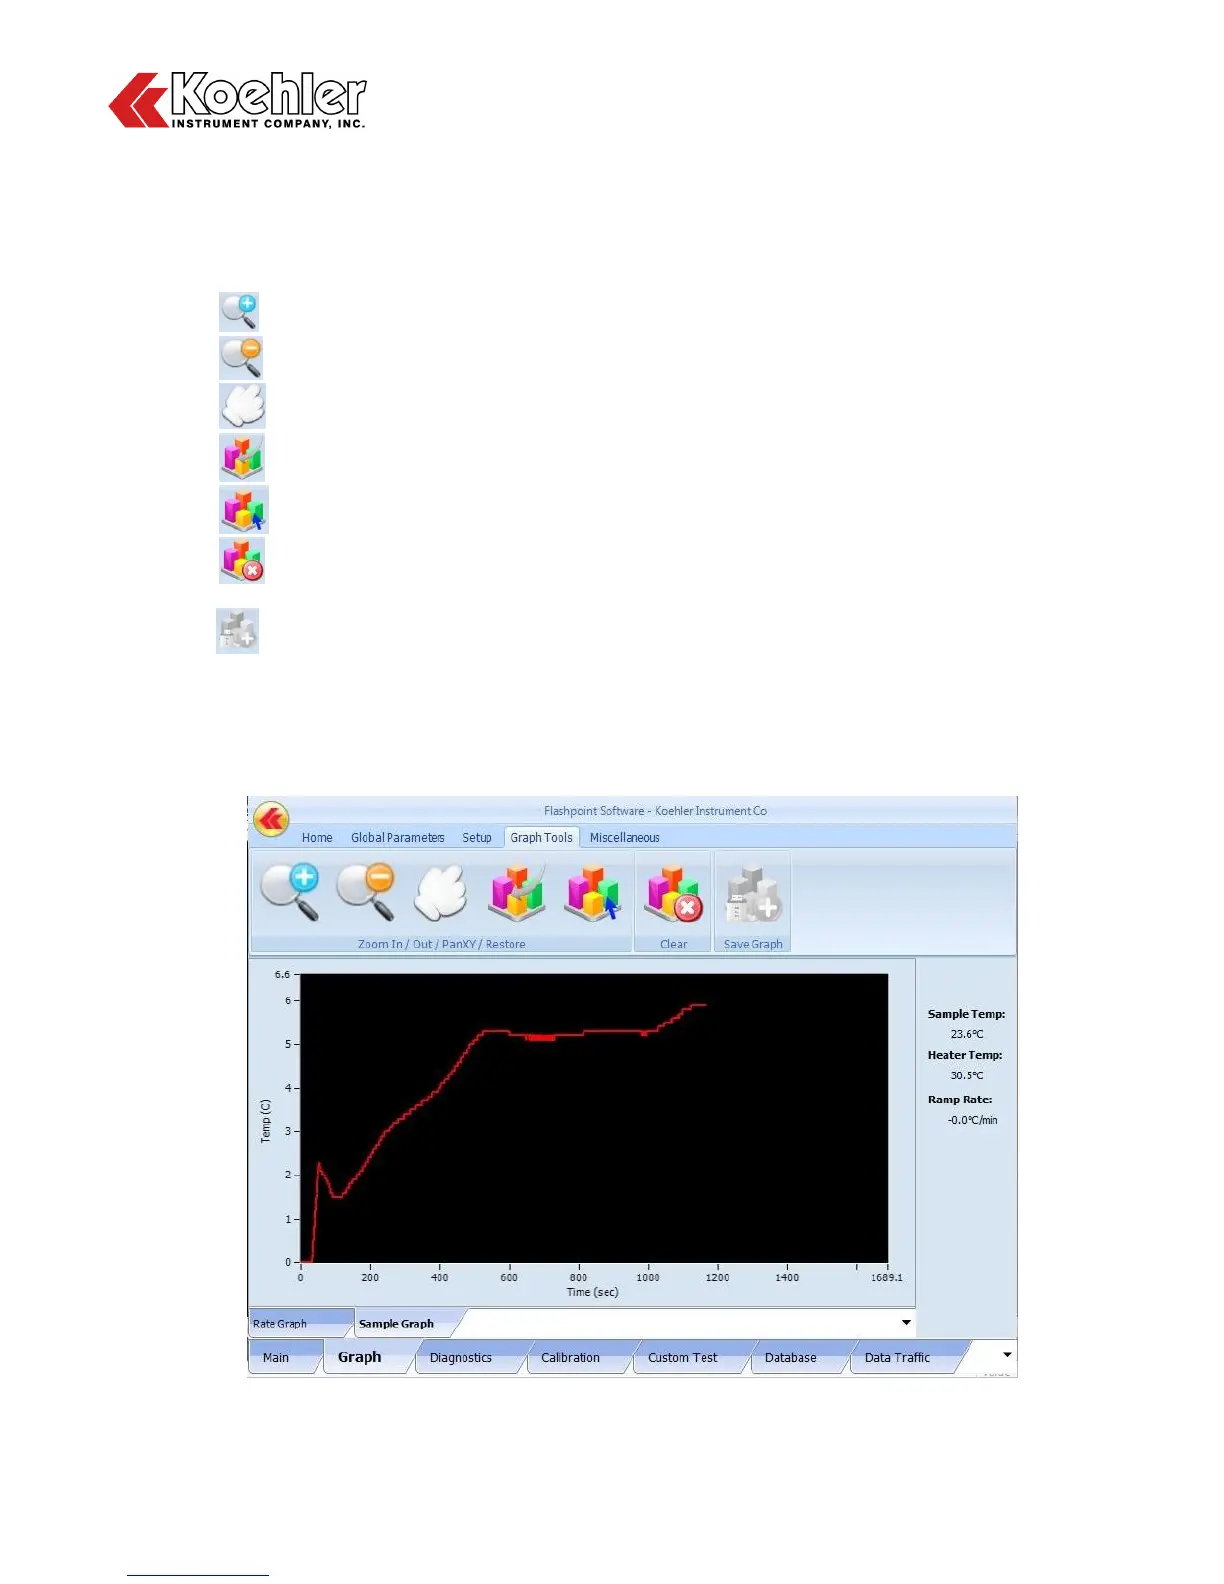
6. Graph Screen - Pressing on the Graph Tab in the Lower Tab Section of the Main Menu allows the
user to see a graphical interpretation of the sample temperature and heating rate during a test.
Sample Temperature, Heater Temperature and Ramp Rate are displayed at the right hand side of
the screen. Accessing the graph screen will also add an additional tab to the Upper Tap Section titled
Graph Tools. The Graph screen features the following functions:
a. Zoom In
b. Zoom Out
c. Pan XY - Provides cursor that can be moved along graph and display data
d. Restore - Resets X and Y Axis to default position
e. Refresh - Manual update of graph
f. Clear - Pressing this button will clear out the graph and the data will begin collecting again
from the origin
g. Save Graph - Function is only activated when a USB is connected to the Analyzer. Clicking
on button will upload current graphical data to the connected USB.
h. Rate Graph Tab - The Rate Graph Tab will display Heating Rate vs Time
i. Sample Graph Tab - The Sample Graph Tab will display Sample Temperature vs Time
Figure 12: Graph Screen