TP-7070 7/1838 Section 2 Operation
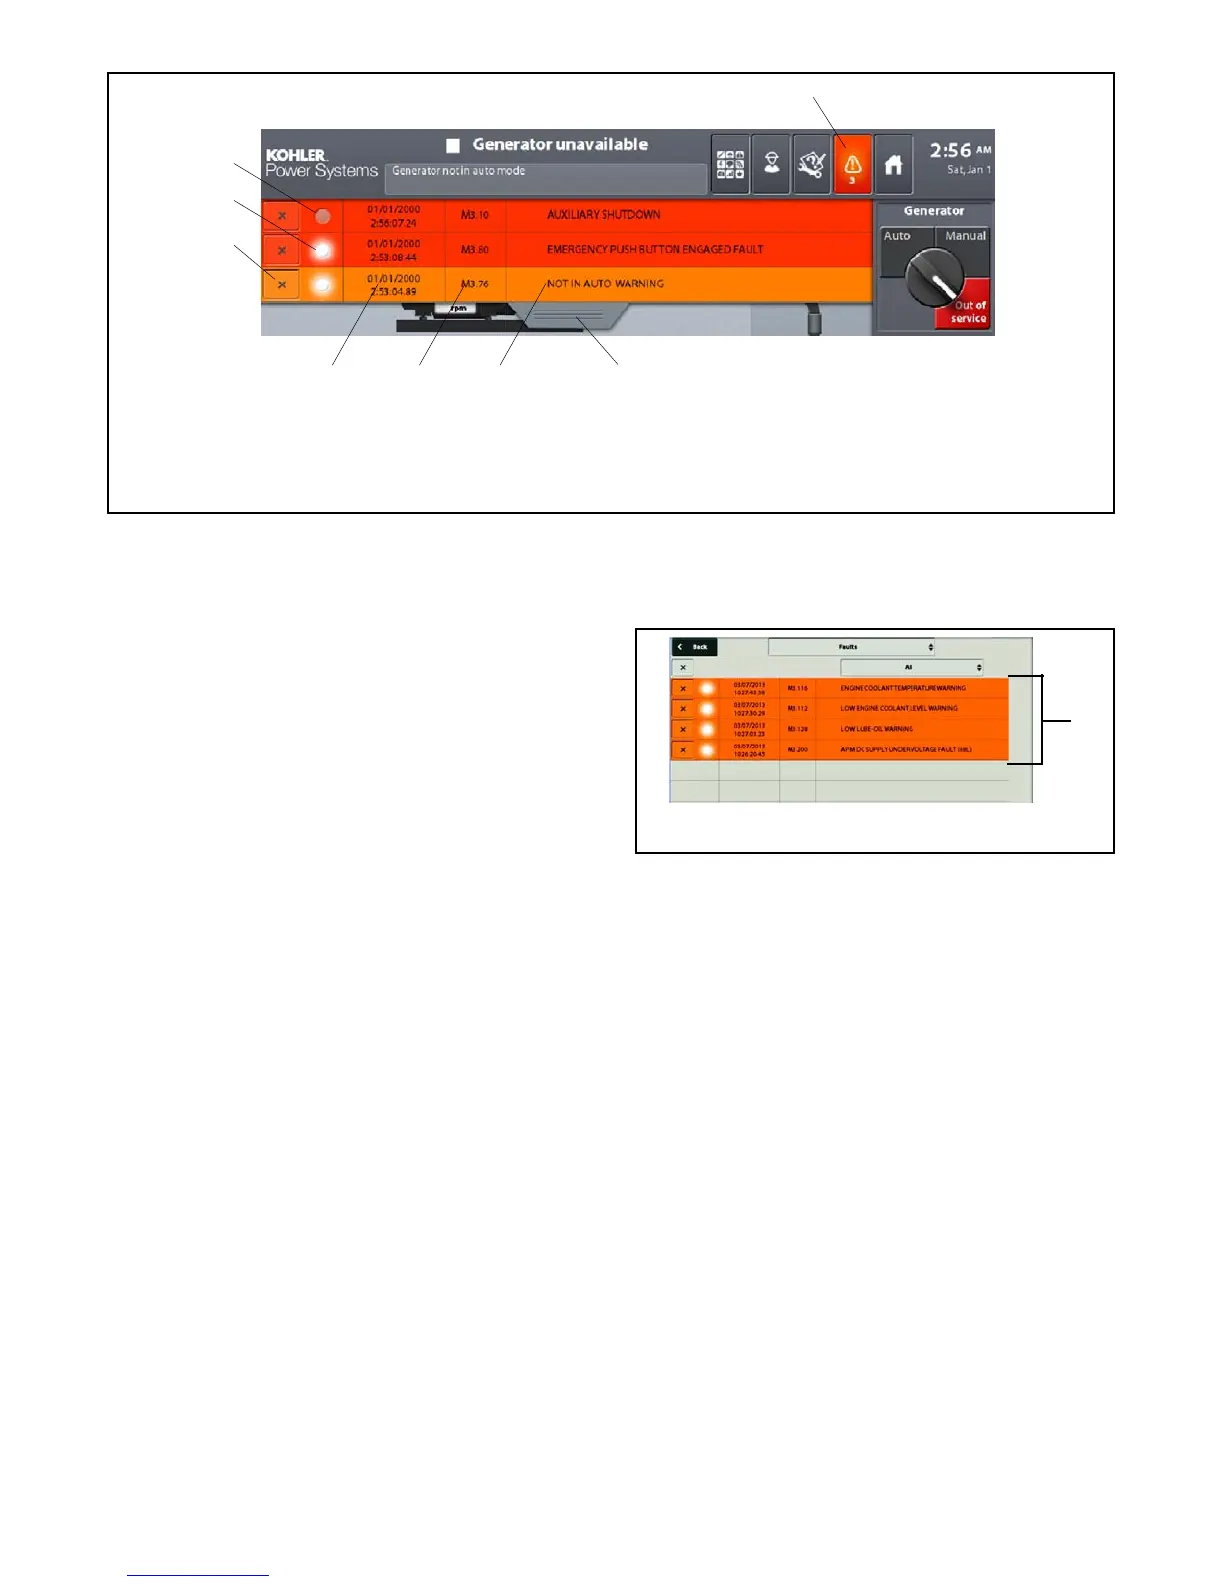
1. Alarm button with number of alarms (press to display list)
2. Pull down tab (press to show full display of additional alarms)
3. Description
4. Internal variable number
5. Date and time of event
6. Reset button (X)
7. Active (on)
8. Not active (off)
8
7
6
1
3
2
45
Figure 2-30 Fault and Alarm List (three most recent faults or alarms)
Press the pull--down tab for access to a full screen
display of any other additional alarms. See Figure 2-31.
The full screen brings up the following:
D < Back button on the operating screen
D Drop-down menu A
D Drop-down menu B
D X button (general reset)
D Complete list of active faults and/or faults not reset
The 4th alarm in Figure 2-31 shows a fault that is
managed as an alarm.
1. List of alarms in chronological order
1
Figure 2-31 Full Screen with Latest Alarms