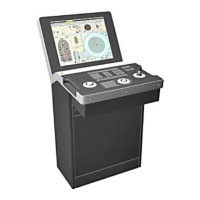
DP Operator Course K-Pos Human Machine Interface
Training Manual
March 2011 Kongsberg Maritime AS Page 3.3.15
Rev. 01 Training
Working areas
The working areas shows operator-selectable display views.
In the following you see an alphabetical list of available standard views. Available views in a
particular vessel depends on the vessels configuration and its operations.
You will find detailed information about the display views in the K-Pos DP Operator manual.
• Deviation view - Shows a combination of graphical and numerical performance data,
particularly related to position and heading deviation.
• General view - Shows a combination of graphical and numerical performance data.
• Joystick view - Shows the thrust setpoint and response during Joystick mode.
• LTW view - Shows the performance of a Light-Weight Taut Wire (LTW) position-
reference system.
• Numeric view - Shows performance data in numerical form.
• Performance area - Shows important performance information to allow immediate
assessment of the situation.
• Posplot view - Shows the vessel’s position and heading.
• Power view - Shows a mimic display of the vessel’s electrical power system.
• Power Consumption - Shows available power for each main bus in numerical form,
and also consumed power for each main bus both in numerical and graphical form.
• Refsys view - Shows the individual and consequent performance of the active position-
reference systems.
• Refsys Status view - Shows the status for each position-reference system or
transponder.
• Rotation Centers view - Shows the position of all the rotation centers available when
the vessel is under automatic control.
• Sensors view - Shows the performance and state of some subset of the vessel’s
sensors, such as gyrocompasses, wind sensors and VRS.
• Thruster views - A main view and sub views for each thruster show how the system is
using the available thrusters to provide the required thrust setpoint. The Setp/feedb
view shows setpoint and feedback data for all the thrusters.
• Trends view - Shows dynamic displays (trend plots) and numerical values for trended
curves of the history over a specified period of selected information.
• Capability view – shows the results of the latest analysis performed by the DP
Capability Analysis function.
• Motion Prediction view – The Motion Prediction view shows the results of the latest
analysis performed by the Motion Prediction Analysis function
• Conning view – The Conning view provides useful information in Autopilot mode,
especially during transit and manoeuvring.

 Loading...