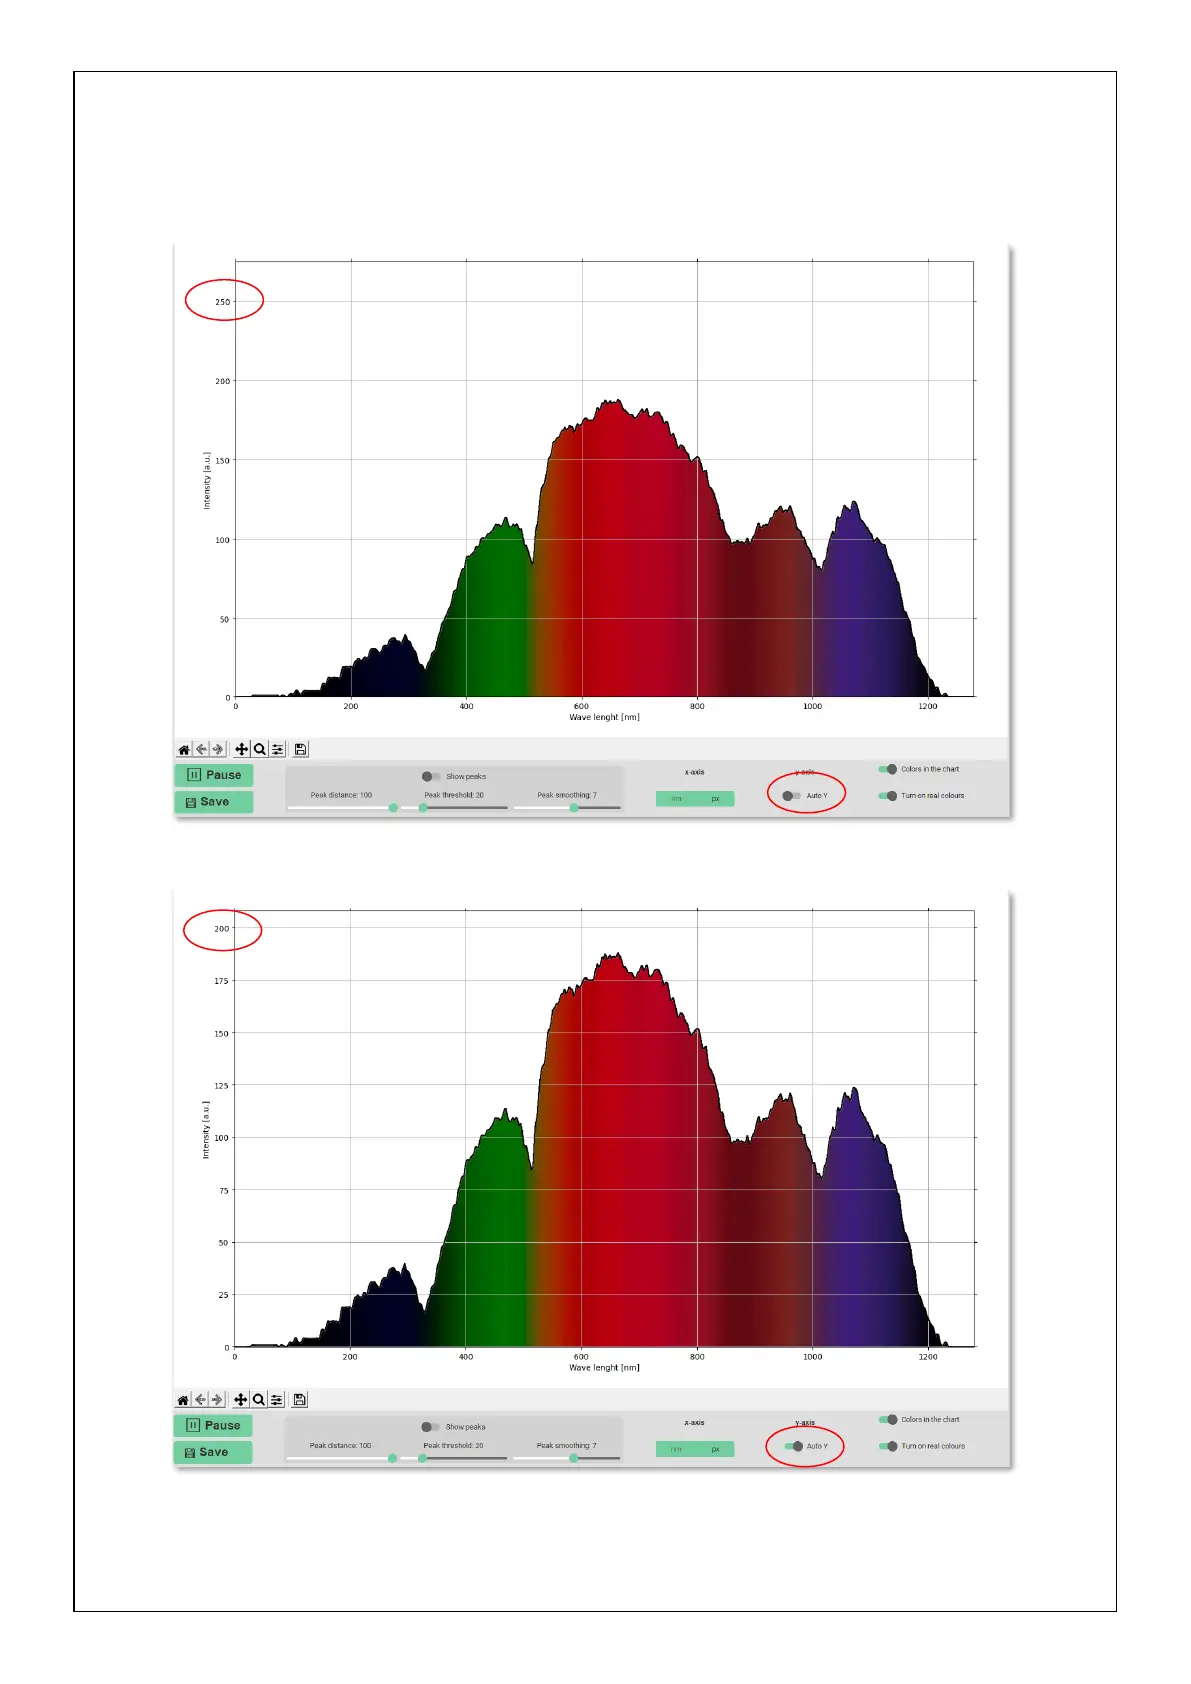
Dependent variable, the y-axis, can be displayed in two optional modes. Automatic mode assigns the range
of the variable a value derived from its lowest and highest value in the graph. Turning off automatic mode
assigns a range corresponding to the lowest and highest value for the selected display method. For normal
graphic outputs, these are values of pixel intensities of 0-255 units.
Fixed y-axis scaling (y-axis range is fixed from 0-255 a.u.).
Automatic y-axis scaling (y-axis range automatically adjusts to the minimum and maximum measured intensity)