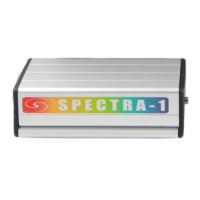
A graphical dependency can have padding under the graph curve. An artificially determined fill or one derived
from image points can be selected with the controls Colours in the graph and Turn on real colours on the
chart panel.
Peaks
The positions of the extremes, most often the peaks, of the spectral dependences have irreplaceable role when
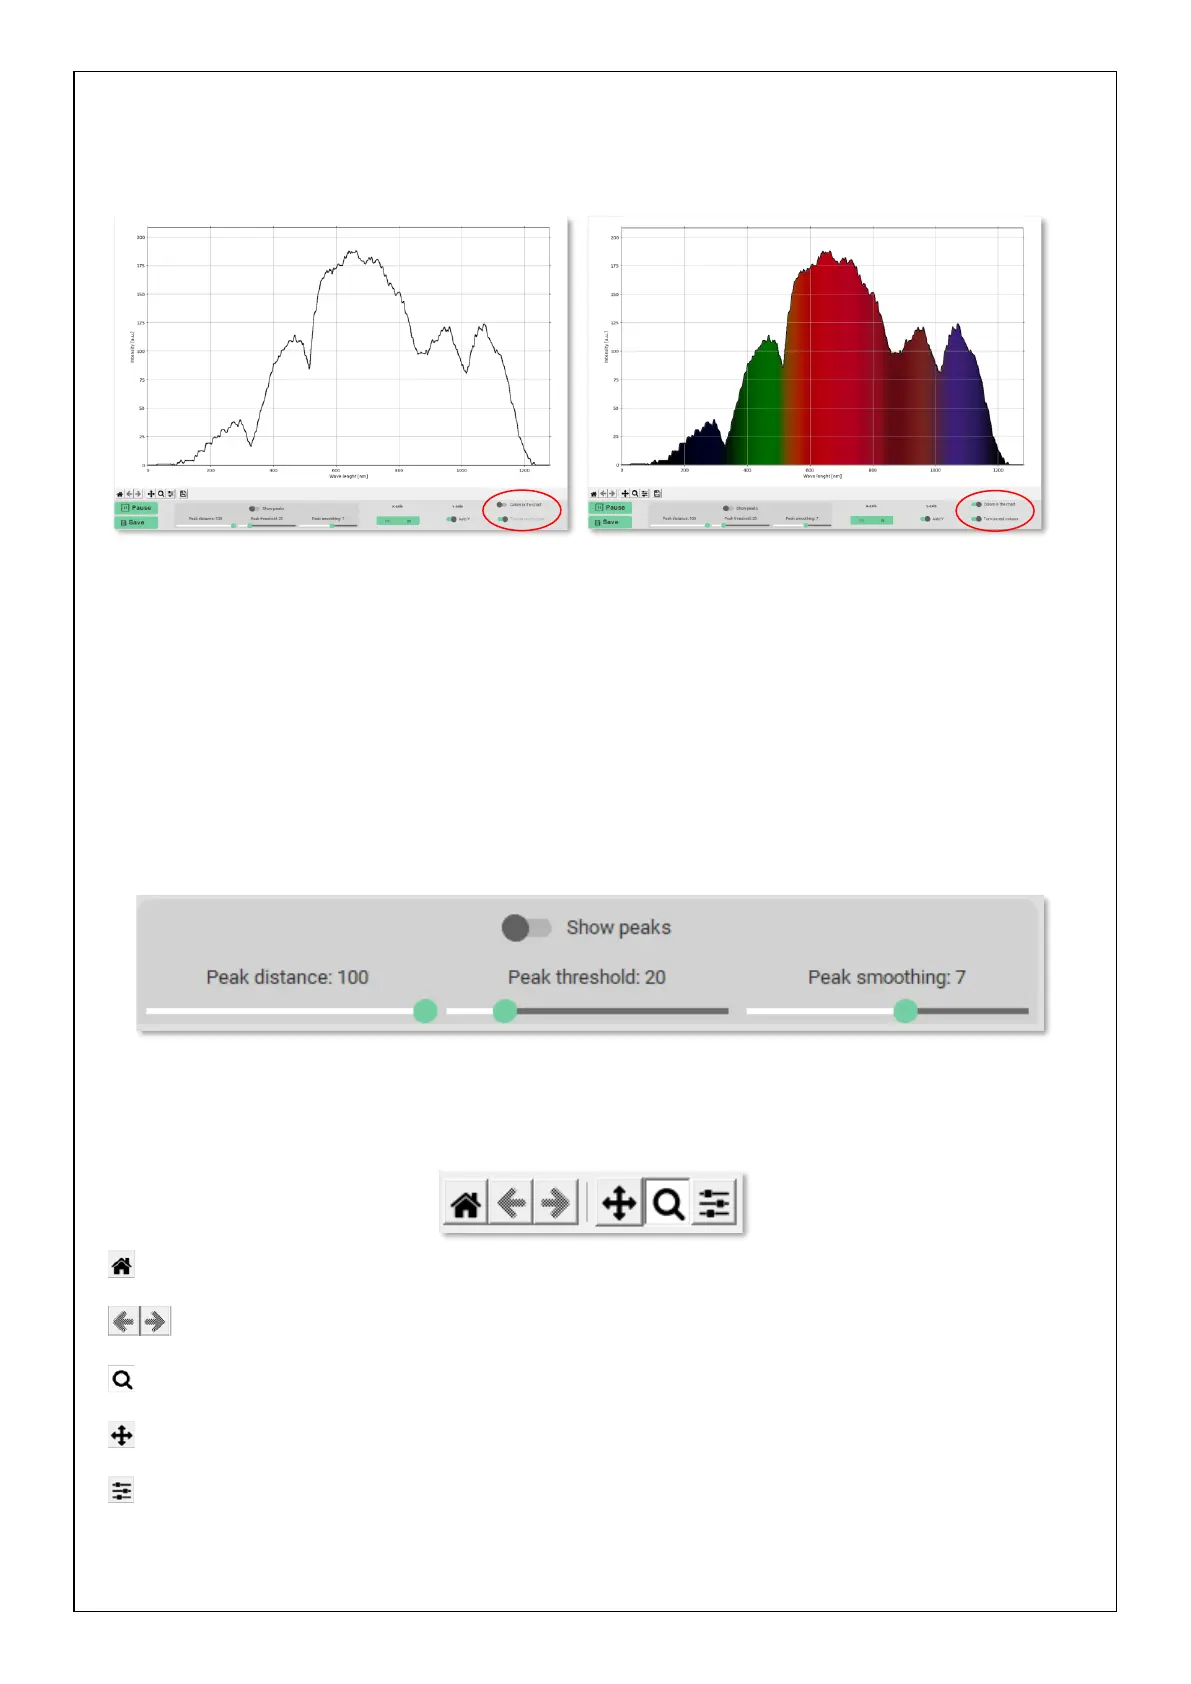
the character of the spectra is considered. In graphical terms, the possibility of highlighting them is accessible
with the Show peaks switch. The conditions for their determination are again optional properties via the Peak
distance, Peak threshold and Peak smoothing controls.
Peak distance – Interval of variable x in which only one peak can be specified
Peak threshold – Excludes the possibility of marking a peak whose height is below a specified value
Peak smoothing – Averaging the surrounding values to determine the peak size
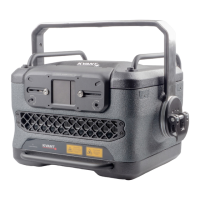
Graph control panel
It is located in the bottom left corner of the chart. These functions are used in suspended mode.
Home - reset the current spectrum settings
A step back and a step forward
Magnifying glass - zoom in on a selected part of the spectrum
Chart movement - scroll, zoom and scale the chart as needed
Slider - additional chart parameter settings