4. Use the buttons at the bottom to change the number of segments or
to display the temperature curve programmed so far:
[Delete] - Removes the currently selected segment (segment
number with a light background) from the program
sequence.
[Undo
delete]
- Reverses the last delete operation.
[Copy] - Inserts a copy of the currently selected segment into
the next line.
[Graph] - Displays the temperature-time diagram of the pro-
gram sequence created so far (all segments).
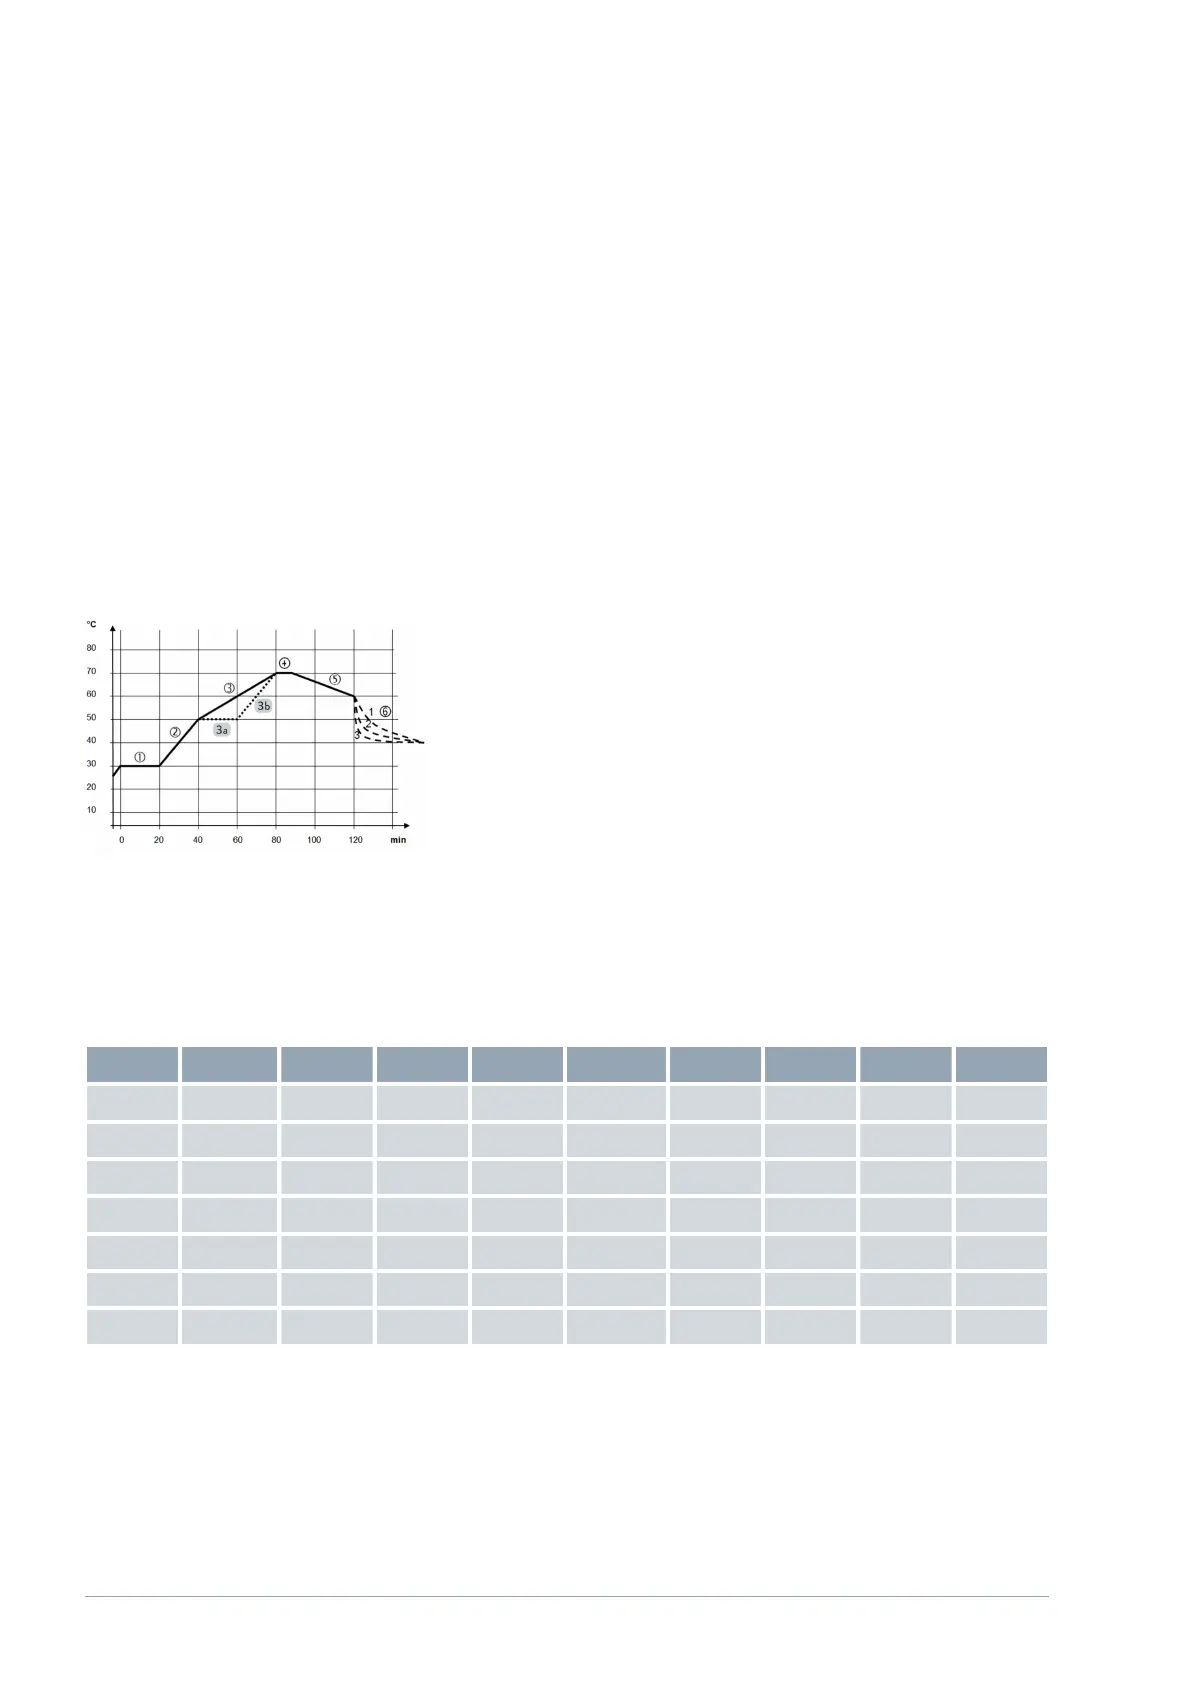
This aim of this example is to show you how it is possible to influence the
temperature profile of a program by changing individual segment settings.
The graphic opposite shows the original profile with a solid line, and the
edited profile with a dotted line. The cooling duration (segment 6) varies
depending on the type of device, application and other factors; it is shown by
dashed lines.
The original profile (solid line) roughly shows three sequence phases; the
values defined for them can be seen in the table below:
Segment 1: The start temperature 30 °C is maintained for 20 min.
Segment 2 – 4: The temperature is increased in 2 phases to 70 °C within
an hour, and then maintained for 10 min.
Segment 5 – 6: The temperature is increased to 60 °C within half an
hour and should then reduce to, and be maintained at, 40 °C without a
time limit, i.e. as quickly as possible.
Table 1: Example of a program with segments
Seg. Seg. type Tend°C Time h:m
DT°C
Pump Control Out1 Out2 Out3
Start Start 30.00 ---- ----- 1 internal ----- ----- -----
1 Maintain 30.00 0:20 ----- 1 internal ----- ----- -----
2 Ramp 50.00 0:20 ----- 6 internal ----- ----- -----
3 Ramp 70.00 0:40 ----- 6 internal ----- ----- -----
4 Maintain 70.00 0:10 ----- 1 internal ----- ----- -----
5 Ramp 60.00 0:30 ----- 4 internal ----- ----- -----
6 Jump 40.00 0:00 ----- 4 internal ----- ----- -----
Example of a program with changes
Fig. 24: Example of a program with tem-
perature profiles
V1Command Touch operating unit30 / 51