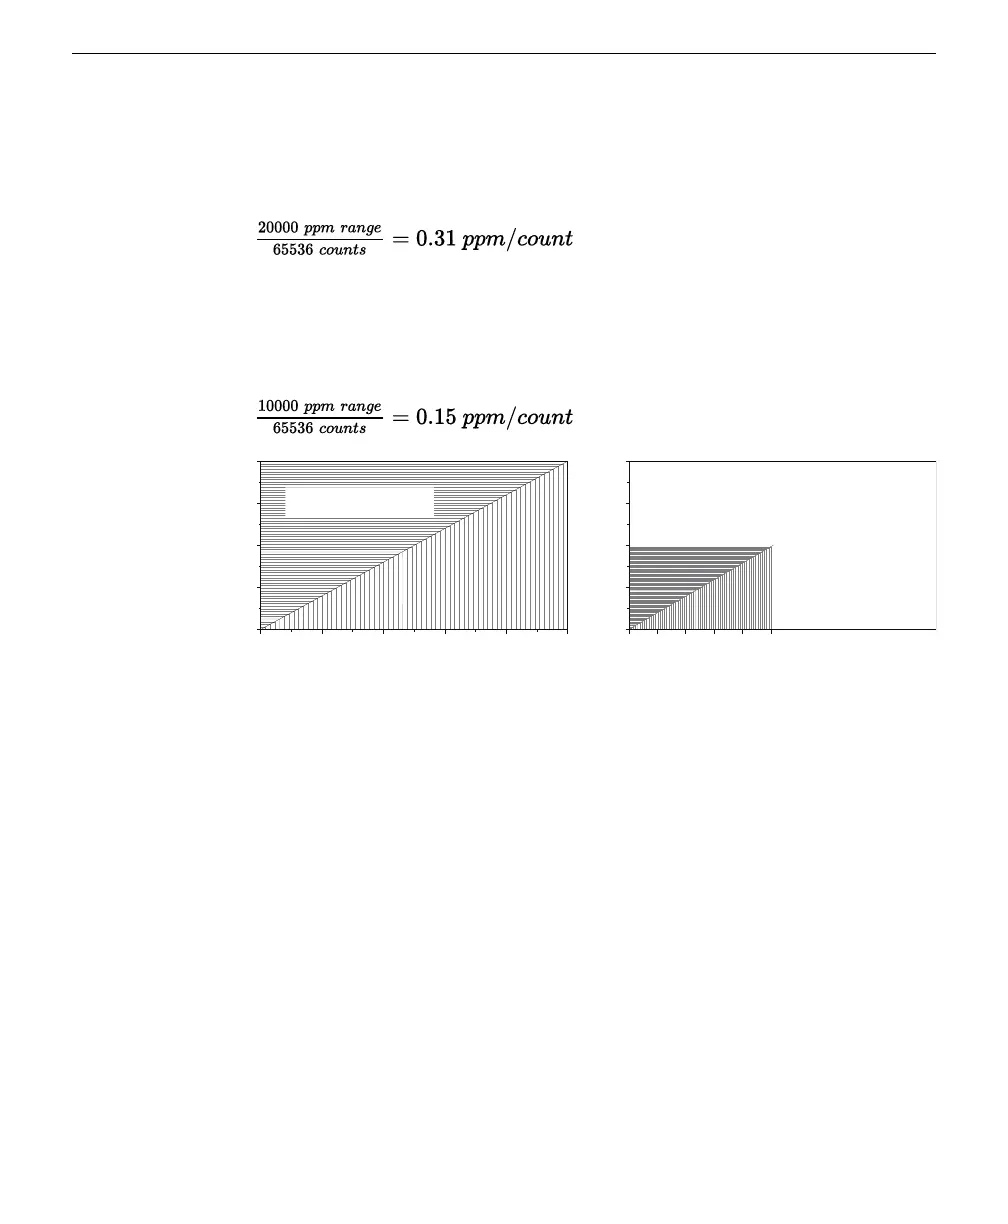
With the 0 to 5 volt output range corresponding with a 0 to 20,000 ppm CO
2
con-
centration range, the finest change in concentration that can be resolved is equal to
0.31 ppm.
3-2
If you are measuring concentrations between 0 and 10,000 ppm, the range is 10,000
ppm. By configuring the DAC range for 0 V = 0 ppm CO
2
and 5 V = 10,000 ppm,
the DAC output will have twice the resolution as it would in the previous con-
figuration.
3-3
20,000
10,000
15,000
5,000
0
0 2 3 4 51
Volts
CO Concentration (μmol mol
-1
)
20,000
10,000
15,000
5,000
0
0 2 3 4 51
Volts
CO Concentration (μmol mol
-1
)
65,536 discreet points over
the 10,000 ppm range gives 2x the resolution
65,536 discreet points over
the 20,000 ppm range
Figure 3-1. The resolution of the analog outputs depends upon the range. If the DACs are
configured to output data over the full 0 to 20,000 ppm range, the data output over the
DACs will have lower resolution (left). If the DACs are configured to output data over a
narrower range (for example, 0 to 10,000 ppm as shown on the right), the data output over
the DACs will have higher resolution.
Also keep in mind that the instrument will not output meaningful information over
the DACs if the measured value is outside of the configured output range.
Computing readings from the DAC output
Here we give some example computations.
Example 1: Computing CO
2
from a voltage output; 0 to 500 ppm range
The CO
2
concentration is calculated from the DAC output. In this example, let's
configure the output range for 0 V = 0 ppm and 5 V = 500 ppm. The concentration
is computed from:
Section 3. Configuring the gas analyzer
3-5Computing readings from the DAC output
 Loading...