The undersize curve À takes the form of “the percentage below a certain size” for
example 20% (reading the figures from the right hand scale) of the sample is
under 40 microns etc.
The oversize curve Á takes the form of “the percentage above a certain size” for
example 80% of the sample is over 40 microns etc. Again the oversize plot uses
the right hand scale to take its percentage scales.
The frequency curve  is obtained by differentiating the cumulative undersize
curve. The peak of the frequency curve gives the modal diameter - the most
commonly occurring particle diameter. Note that the frequency curve is scaled to
be approximately the same height as the analysis size band histogram.
The histogram plot à shows the percentage of the volume of the sample that is
within a particular size band (% in). Histogram plots use the left hand scale. It is
the height of the histogram bars that are of interest, not the area under the bar.
Each bar represents a size band of particles - on the initial analysis the size bands
are determined by the physical design of the detector. Once analysed the user can
set the number of size bands.
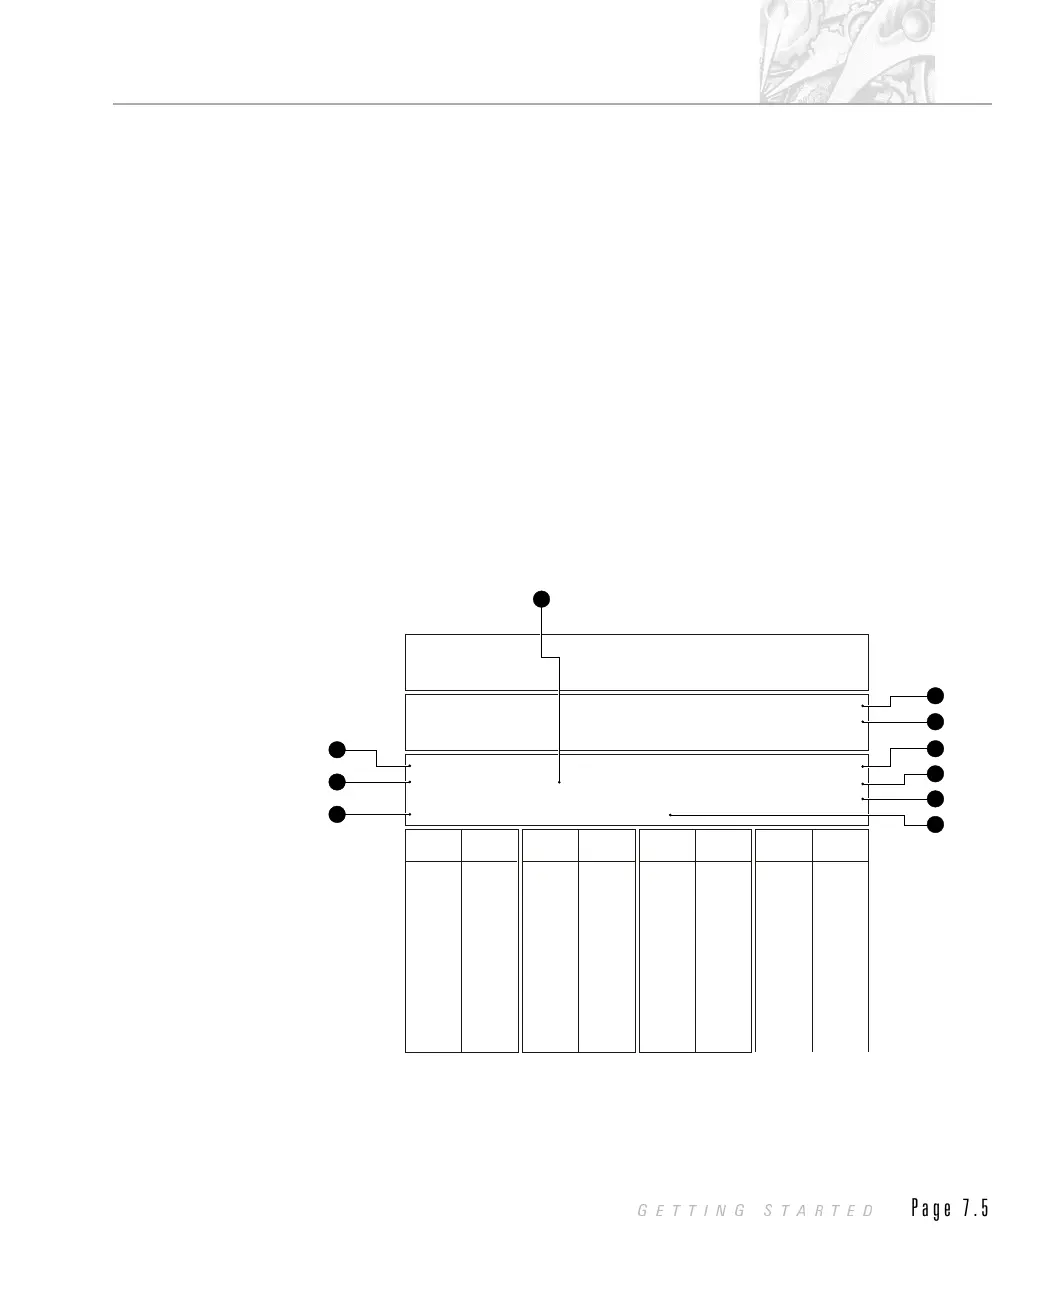
A typical report is shown below, followed by a brief description of the key features.
À The residual, as stated earlier, is an indication on how well the analysis data
was fitted to the measurement data. A good fit is indicated by a residual of under
1%. If the residual is over 1% then this may be an indication that you have not
Result: Analysis Table
ID: SampleD Run No: 1 Measured: 9/08/94 14:52
File: MSSTEST Rec. No: 3 Analysed: 9/08/94 14:54
Path: C:\SIZERS\DATA\ Source: Analysed
Range:1000 mm Beam: 2.40 mm Sampler: None Obs': 10.3 %
Presentation:3$$D Analysis: Polydisperse Residual: 0.617 %
Modifications:None
Conc. = 0.3827 %Vol Density = 1.000 g/cm^3 S.S.A.= 0.0238 m^2/g
Distribution: Volume D[4, 3] = 260.14 um D[3, 2] = 252.31 um
D(v, 0.1) = 211.47 um D(v, 0.5) = 253.18 um D(v, 0.9) = 319.36 um
Span = 0.43 Uniformity = 0.14
Size
(um)
Volume Size
(um)
Volume Size
(um)
Volume Size
(um)
Volume
In %
4.19
4.88
0.00
5.69
0.00
6.63
0.00
7.72
0.00
9.00
0.00
10.48
0.00
12.21
0.00
14.22
0.00
16.57
0.00
19.31
0.00
22.49
0.00
In %
22.49
26.20
0.00
30.53
0.00
35.56
0.00
41.43
0.00
48.27
0.00
56.23
0.00
65.51
0.00
76.32
0.00
88.91
0.00
103.58
0.00
120.67
0.00
In %
120.67
140.58
0.07
163.77
0.47
190.80
2.71
222.28
14.15
258.95
38.71
301.68
29.50
351.46
9.89
409.45
3.39
477.01
0.96
555.71
0.15
647.41
0.00
In %
647.41
754.23
0.00
878.67
0.00
1023.66
0.00
1192.56
0.00
1389.33
0.00
1618.57
0.00
1885.64
0.00
2196.77
0.00
2559.23
0.00
2981.51
0.00
3473.45
0.00
1
7
6
5
2
4
9
8
10
3
ILL 2063
CHAPTER 7
GETTING STARTED
Page 7.5
 Loading...