Hydrogen Generator NM Series 2 User’s Manual
11
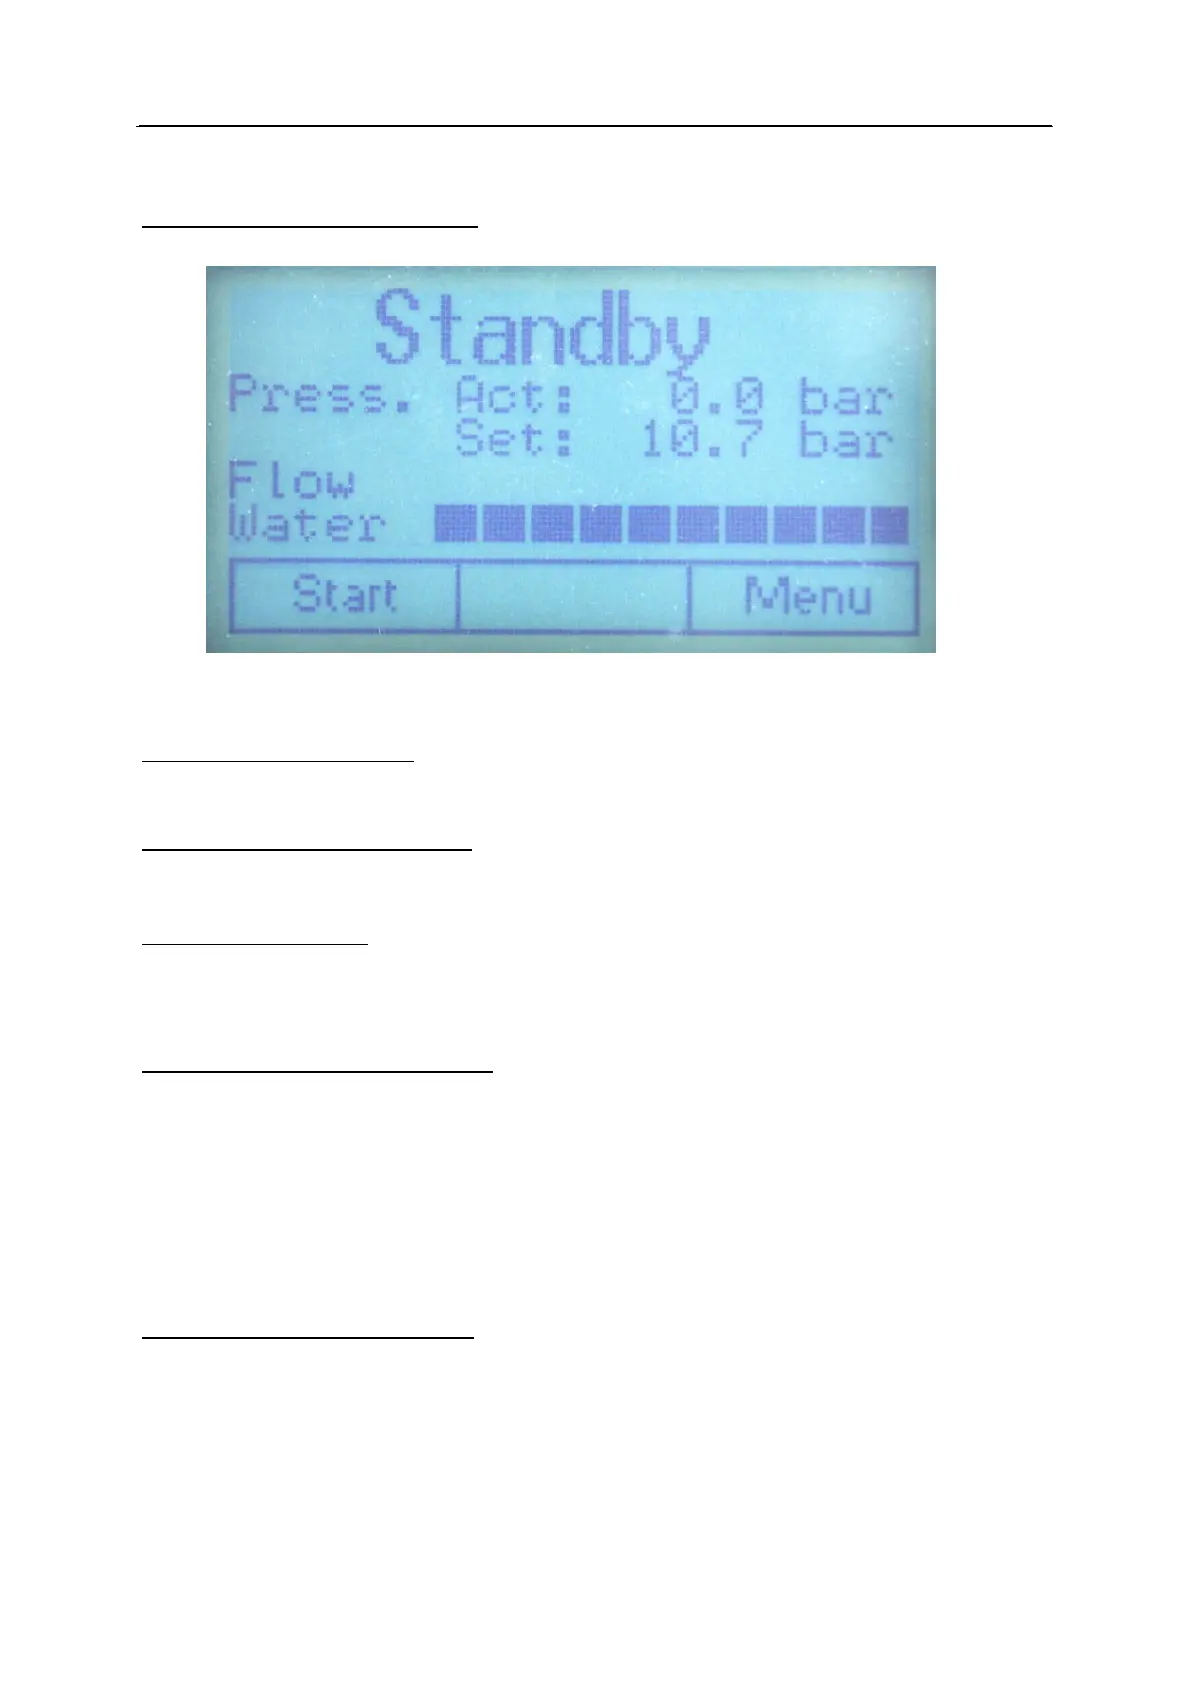
Layout of the Start up display
Fig. 13
First row, status information
The Status: shows current information on the operating status of the generator.
Second row, pressure information
“Press Act”: is the actual pressure of the hydrogen outlet.
Third row, set pressure
“Set” is the adjusted pressure in the pressure set menu.
Forth row, hydrogen flow Bar Graph
This row displays the current quantity of hydrogen being produced. Each segment
represents around 10 % of maximum capacity. This graph also indicates how much
hydrogen is being consumed by the connected equipment.
Note: during initial build up of the internal and external pressure and to maintain the
internal pressure, the displayed flow will temporarily go to maximum and deviate
from the actual flow on the gas outlet.
Fifth row, water quality Bar graph
This graph shows the quality of the water in the reservoir.
With more than 7 segments illuminated, water quality is good.
If only 3 or less points are illuminated, the conductivity of the water is around 30 uS
(pre-alarm level). If only 1 segment or no segments are illuminated, the conductivity of the
water is equal to or greater than 40 uS (alarm). The generator will shut down.
 Loading...