EN
8
By the zoom y-axis icon you can zoom in overall y-axis parameter.
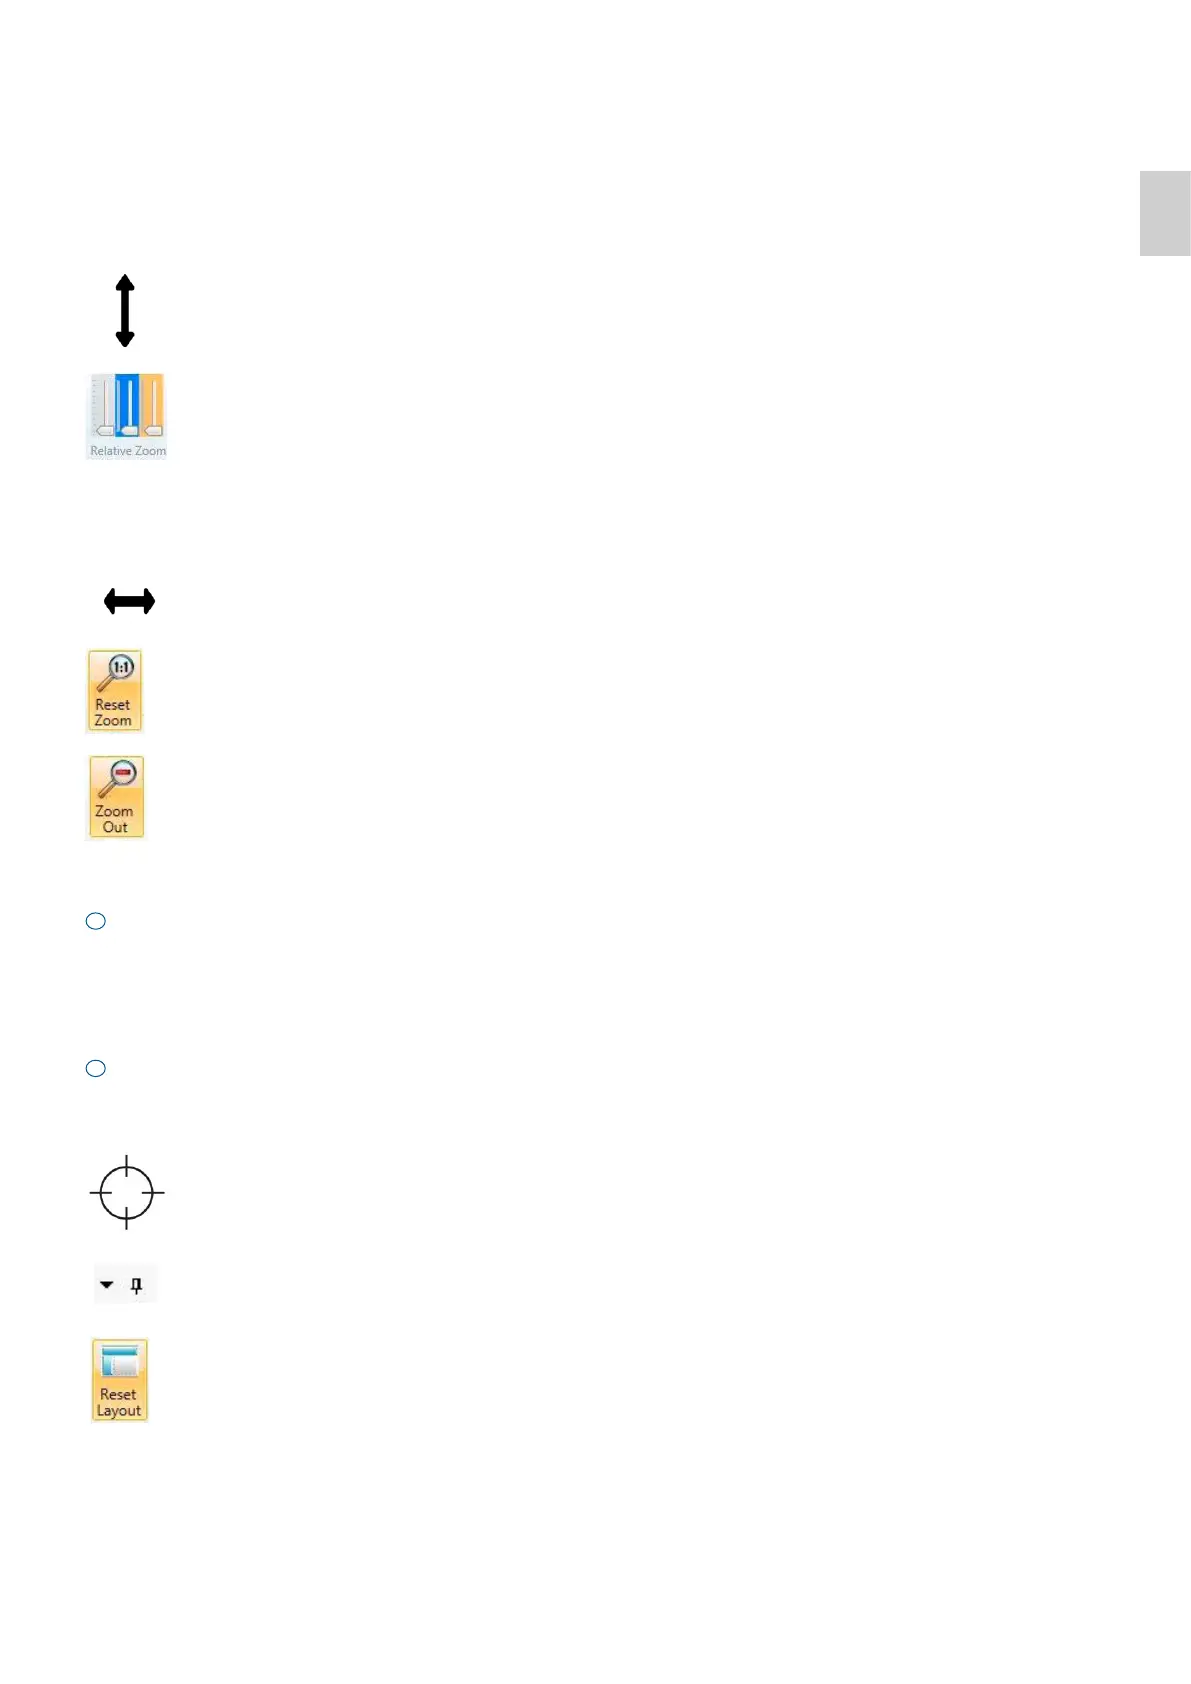
By the relative zoom icon you can individually zoom in each parameter.
With the zoom out icon you can zoom out by keeping the ratio.
x-axis (horizontal axis)
By the zoom x-axis icon you can zoom in the timeline axis.
By the reset zoom icon you can reset all zoom modifications.
Event View
The event view shows all occurred events during therapy.
You can scroll over the events and find more information or when occurred.
WARNINGS — will be shown in yellow
ALARMS — will be shown in red
Other events — will be shown in grey
The tracking line can be used to find events or specific data points in the graph.
Depending on the tracking line position, the data on negative pressure, air leak and fluid is shown.
d
e
By pressing the tracking line icon you can better find your tracking line in the graph.
By the positioning icon and the auto hide icon you can replace or hide windows.
Note: If you display data from a Thopaz device, the software will show graphs without information about fluid.
Note: If the curves are interrupted, the device was switched off during therapy and the question "New patient"?
was answered with "no" or the device was in standby.
Reset all layout modifications.