EN
7
3.4 ThopEasy
+
windows
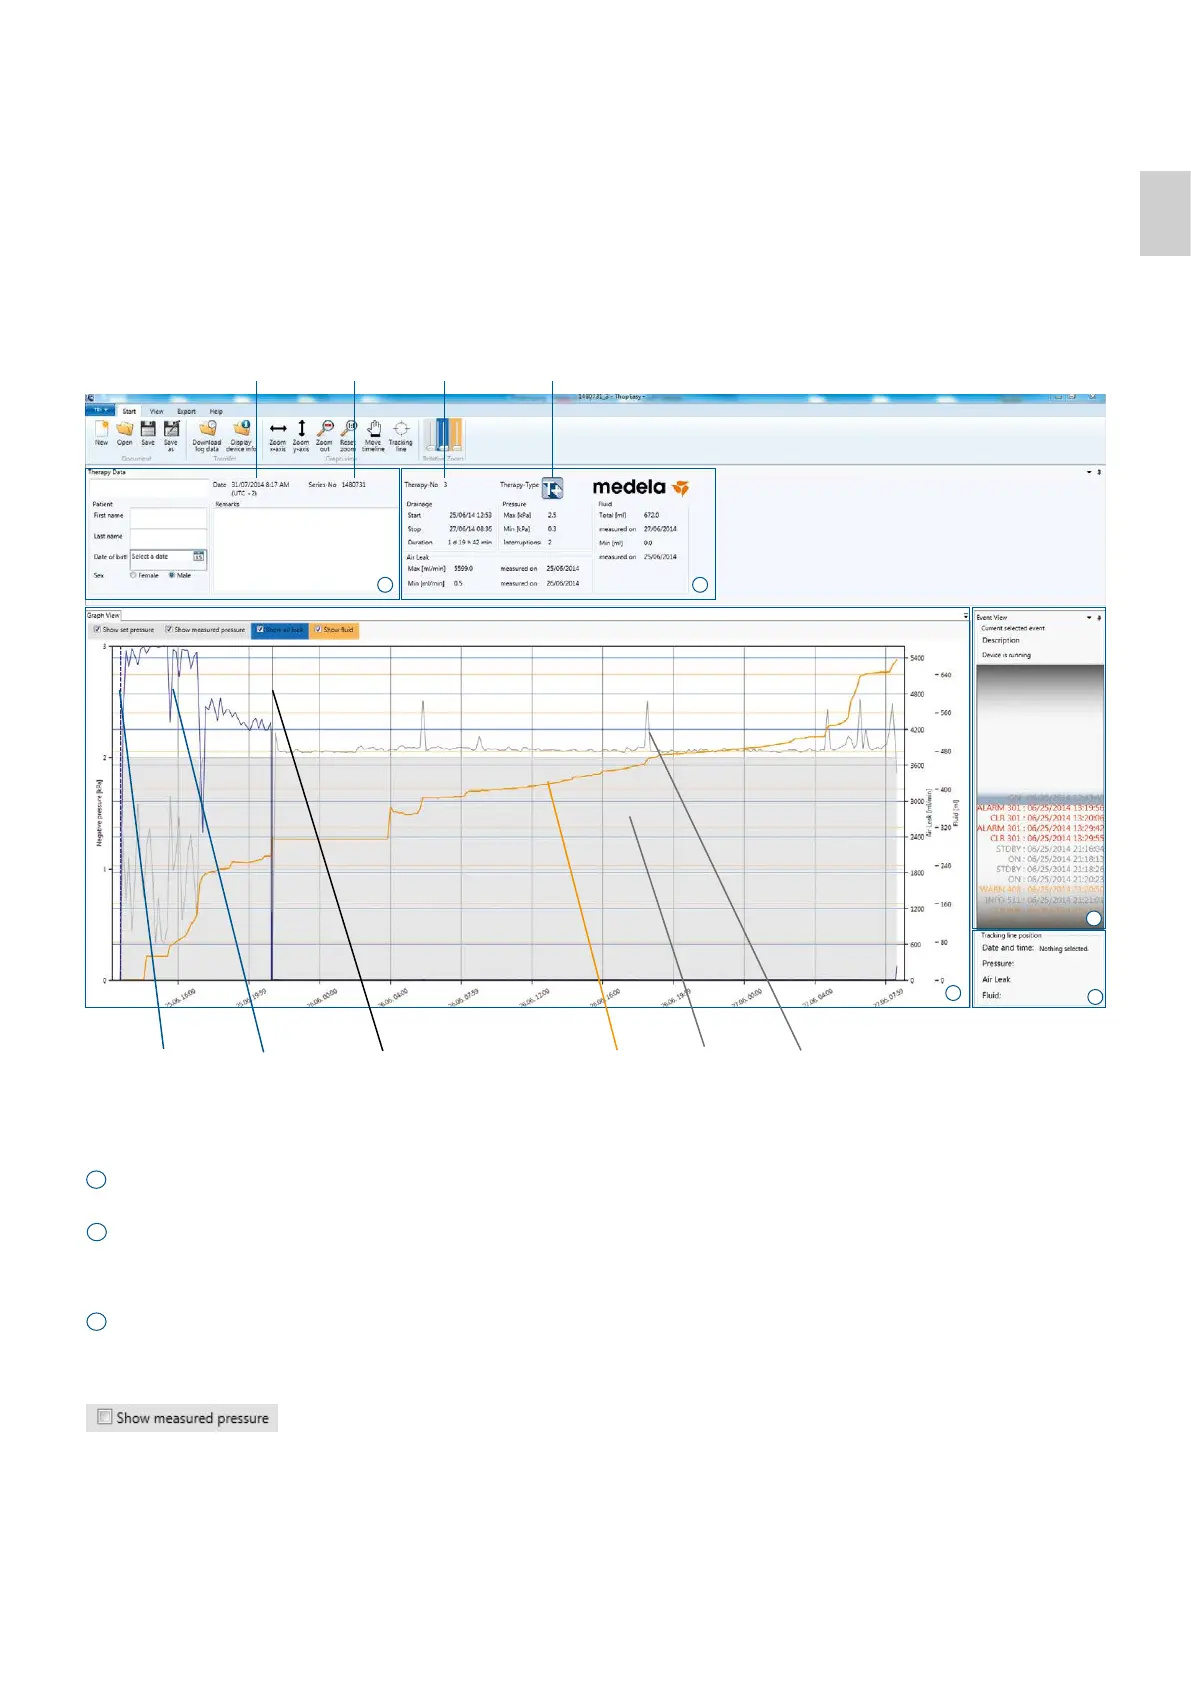
Serial No. (cannot
be changed)
Time of data
transfer to PC
a
b
c
Therapy No. Therapy type
Tracking line Air leak curve This line indicates
a canister change
Fluid curve
Set
pressure
Measured
pressure curve
Therapy Data
Additonal data about patient or treatment can be entered here.
This data can be edited, printed or saved in the .thpx file.
General therapy data is displayed.
Graph View
The graph view shows set pressure (pressure you set on the device), measured pressure (pressure at tubing connector),
air leak (air flow) and fluid.
Parameters can get hidden by removing the hook.
Fluid is only shown for data obtained from Thopaz
+
devices during the therapy.
y-axis (vertical axis)
Left: negative pressure — curve in grey
Right: air leak (air flow) — curve in blue
Right: Fluid — curve in orange
a
b
c
d
e