VP-ITC MicroCalorimeter User’s Manual
Observe the Baseline while Equilibrating
At the start of the experiment the instrument may rapidly bypass certain stages of operation. If
the instrument’s temperature is at the selected starting temperature the instrument will skip the
seeking temperature and pre run thermostatting phase and move immediately on to the final
baseline equilibration phase. If your instrument is not at the entered starting temperature you may
have to wait an extended period of time prior to the final baseline equilibration state. The states
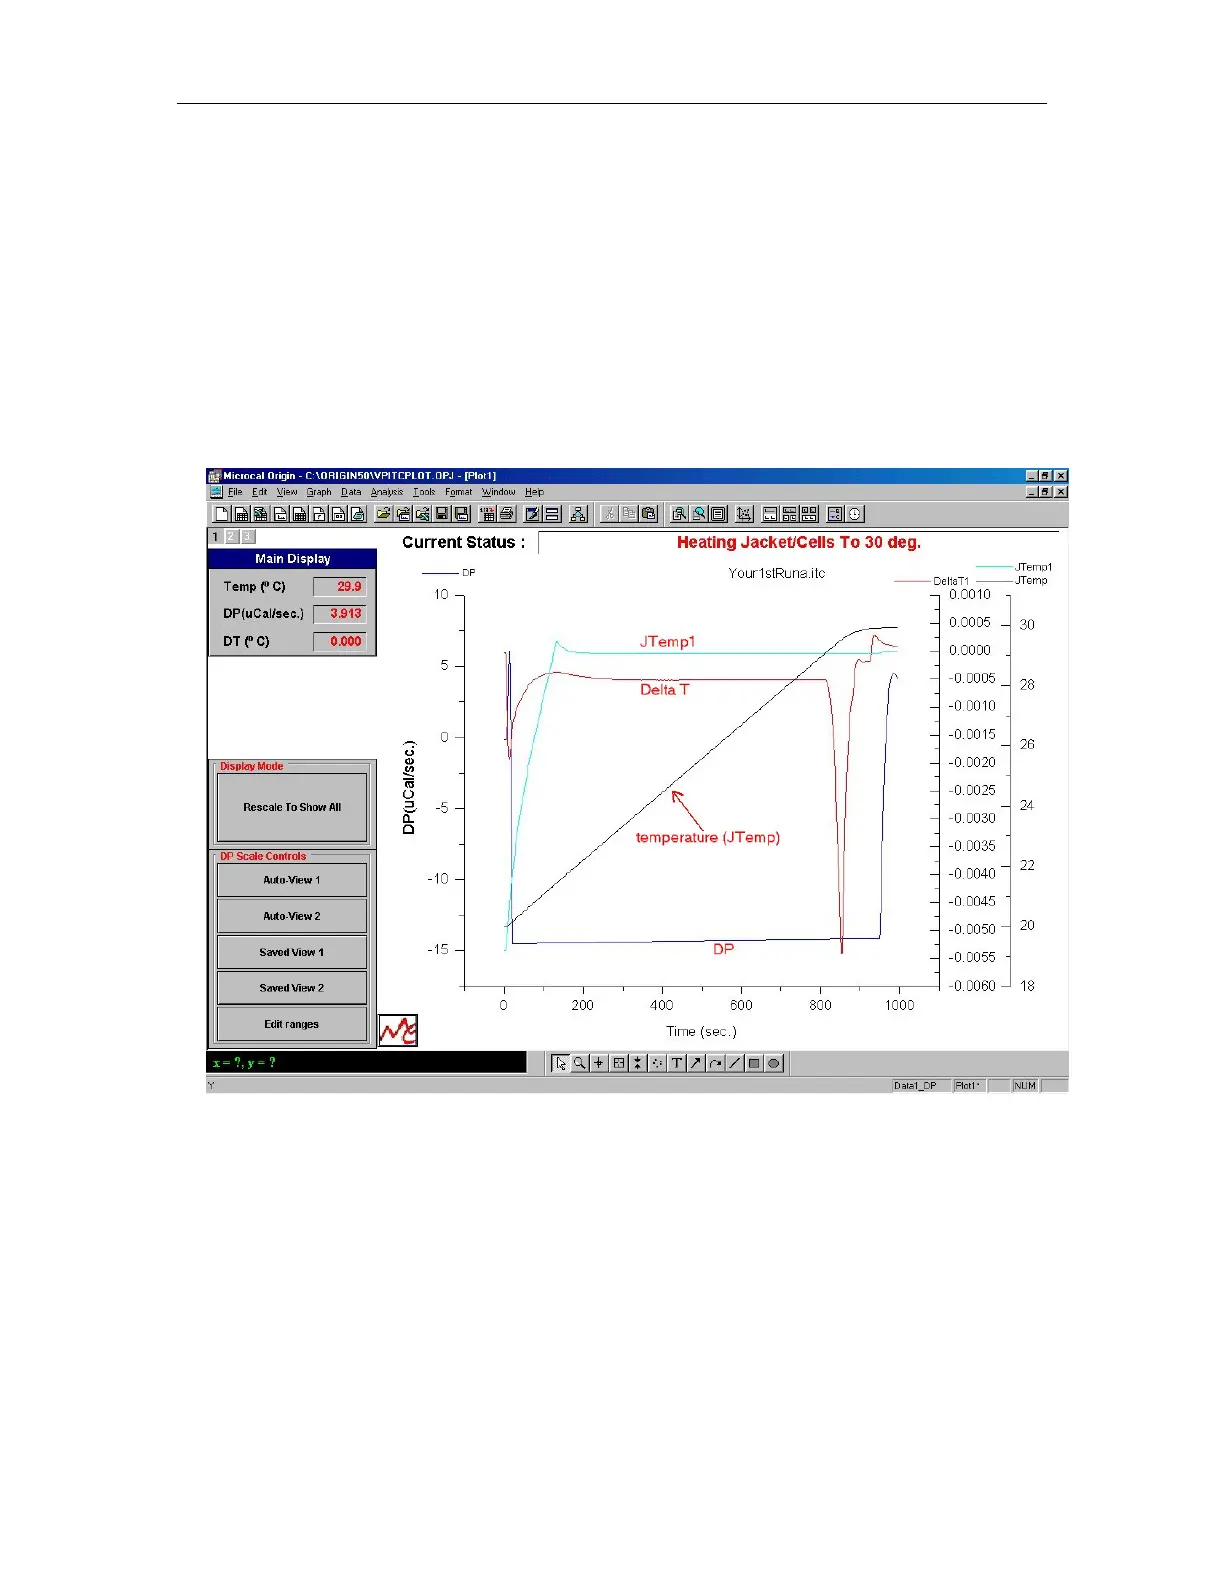
of operation are displayed in VPViewer and Origin at the top, right in red. Displayed below is
data from an instrument that started at a temperature lower than the desired experimental
temperature and is showing the temperature rising to 30 degrees and stabilizing at the starting
temperature.
Displayed above are three different Y-axis scales with four different data sets being plotted in the
graph. Each Y-axis is plotted in its own layer (see Origin User’s Manual for more information
about layers). You can see the layer button located in the upper left corner of the graph. The
black number on the gray button indicates the active layer while the inactive layers have white
numbers. You may set a layer as active by clicking on the layer button or on the corresponding
Y-axis.
The Y-axis on the left is colored blue and the data set plotted in this layer (also colored blue) is
the DP data (DP data is the differential power between the reference and sample cell). When Pre-
stirring equilibration is first started the data may not be visible on the graph. One can click on the
Auto-View 2 button to center the current data point with a Y-axis full scale of 1. When the cell
56