26 www.sigma-aldrich.com
There may be an initial NWP decline after initial use and exposure
to cleaning solutions. Stable NWP from run to run is achievable
thereafter until the membrane starts to reach the end of life, at which
point a steady change in NWP will usually be observed and process
performance measurements such as process time, permeate flux or
product yield are affected.
The acceptance criterion for cleaning efficacy as measured by
NWP is membrane and application specific and may vary between
facilities. Of key importance are stable process flux and no carry
over from previous runs.
If the NWP decreases significantly from run to run, cleaning
procedures may be inadequate. Alternative cleaning agents and
procedures should be investigated.
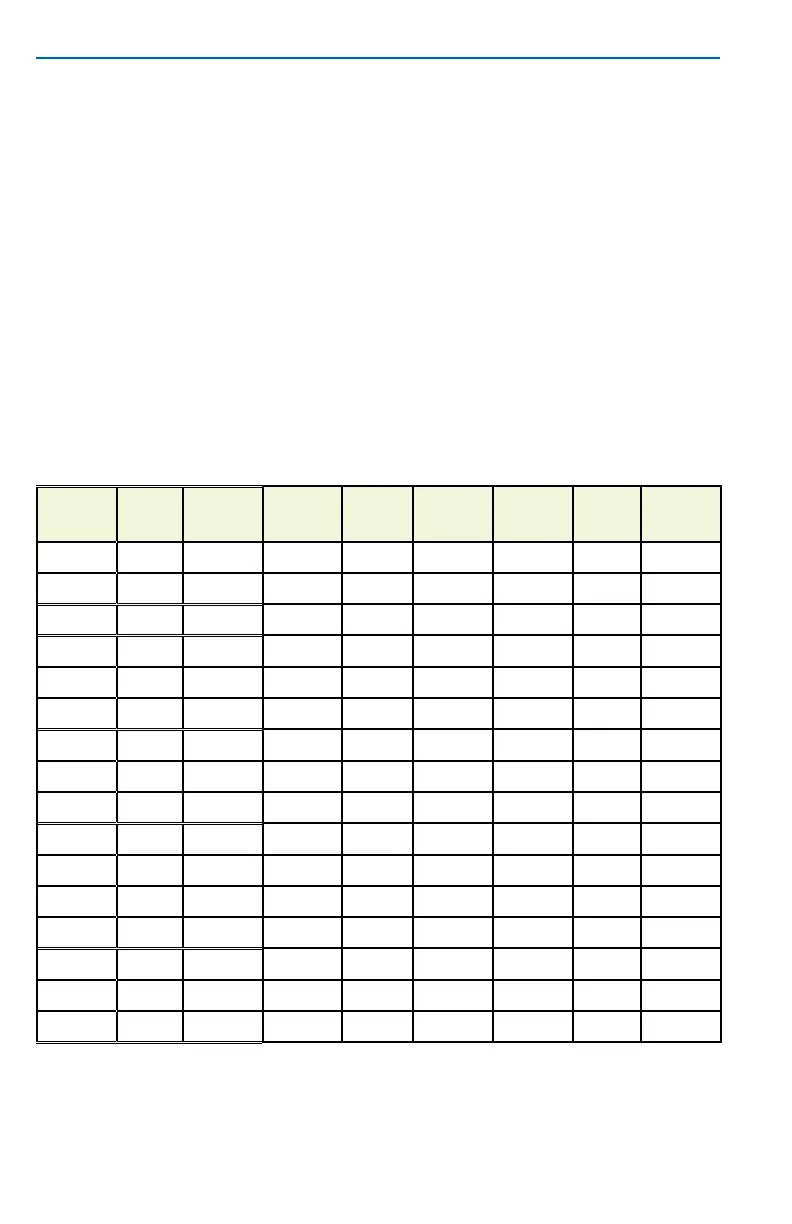
NWP Temperature (T) Correction Factor (F)*
T
(°F)
T
(°C)
F
T
(°F)
T
(°C)
F
T
(°F)
T
(°C)
F
125.6 52 0.595 96.8 36 0.793 68.0 20 1.125
123.8 51 0.605 95.0 35 0.808 66.2 19 1.152
122.0 50 0.615 93.2 34 0.825 64.4 18 1.181
120.2 49 0.625 91.4 33 0.842 62.6 17 1.212
118.4 48 0.636 89.6 32 0.859 60.8 16 1.243
116.6 47 0.647 87.8 31 0.877 59.0 15 1.276
114.8 46 0.658 86.0 30 0.896 57.2 14 1.310
113.0 45 0.670 84.2 29 0.915 55.4 13 1.346
111.2 44 0.682 82.4 28 0.935 53.6 12 1.383
109.4 43 0.694 80.6 27 0.956 51.8 11 1.422
107.6 42 0.707 78.8 26 0.978 50.0 10 1.463
105.8 41 0.720 77.0 25 1.000 48.2 9 1.506
104.0 40 0.734 75.2 24 1.023 46.4 8 1.551
102.2 39 0.748 73.4 23 1.047 44.6 7 1.598
100.4 38 0.762 71.6 22 1.072 42.8 6 1.648
98.6 37 0.777 69.8 21 1.098 41.0 5 1.699
*Based on Water Fluidity Relative to 25 ºC (77 ºF) Fluidity Value
F= (µ
T ºC
/µ
25 ºC
) or (µ
T ºF
/µ
77 ºF
)