SYSTEM TEMPERATURE RISE CHART
20°Δt 25°Δt 30°Δt 35°Δt 40°Δt 45°Δt
Model
Friction
Feet
Flow
G P M
Friction
Feet
Flow
G P M
Friction
Feet
Flow
G P M
Friction
Feet
Flow
G P M
Friction
Feet
Flow
G P M
Friction
Feet
Flow
G P M
Mod Con 300 19’ 30 12’ 24 9’ 20 7’ 17 6’ 15 5’ 14
Mod Con 500 19’ 50 11’ 40 8’ 33 6’ 28 5’ 25 4’ 23
Mod Con 850 35’ 85 26’ 65 18’ 54 12’ 45 10’ 40 8’ 36
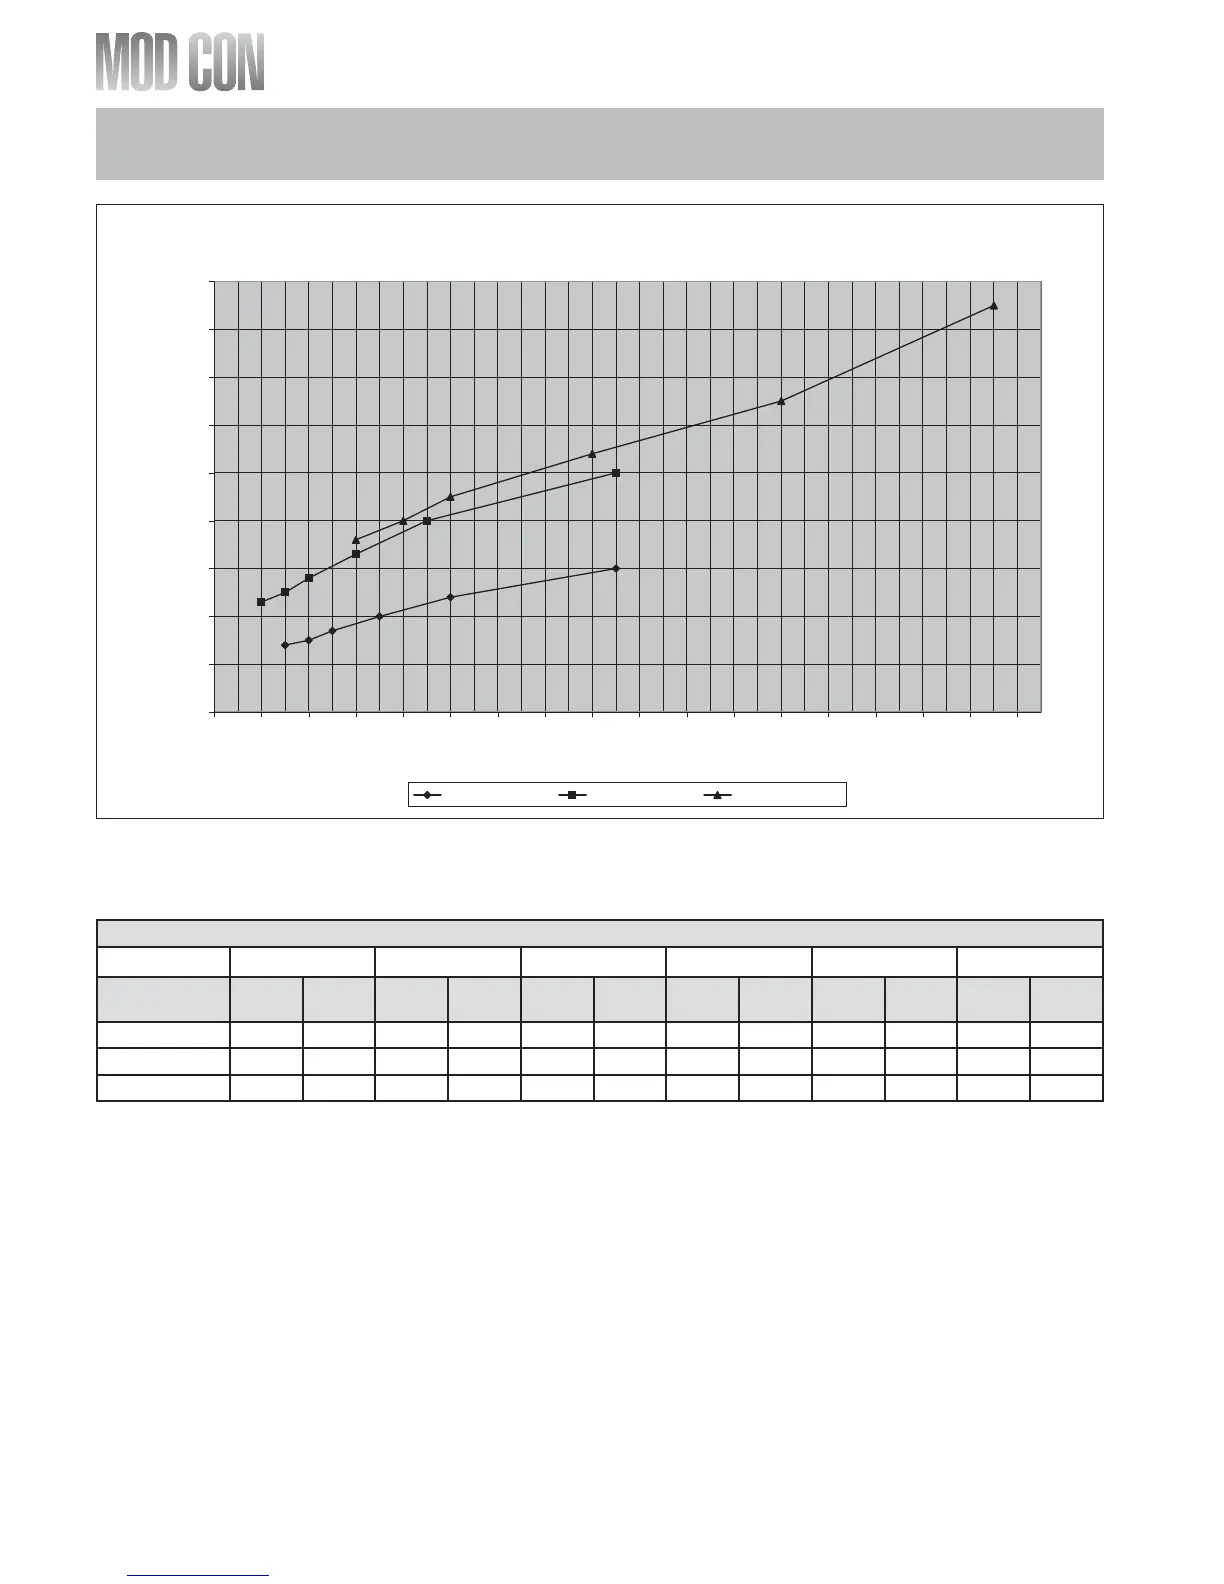
The chart below represents the various system design temperature rise through the Mod Con along
with their respective flows and friction loss which will aid in circulator selection.
PART 5: BOILER PIPING (CONTINUED)
Figure 5-1
LP-205-E Rev. 12/5/07