- –
21
To zoom in and zoom out data regions, there are several
approaches, these are:
1. Use the mouse to click and drag a box around any data
area to magnify the area selected.
2. Click on the zoom magnifier icon tool on the menu bar
3. Select VIEW ALL or ZOOM OUT from the VIEW pull-
down menu.
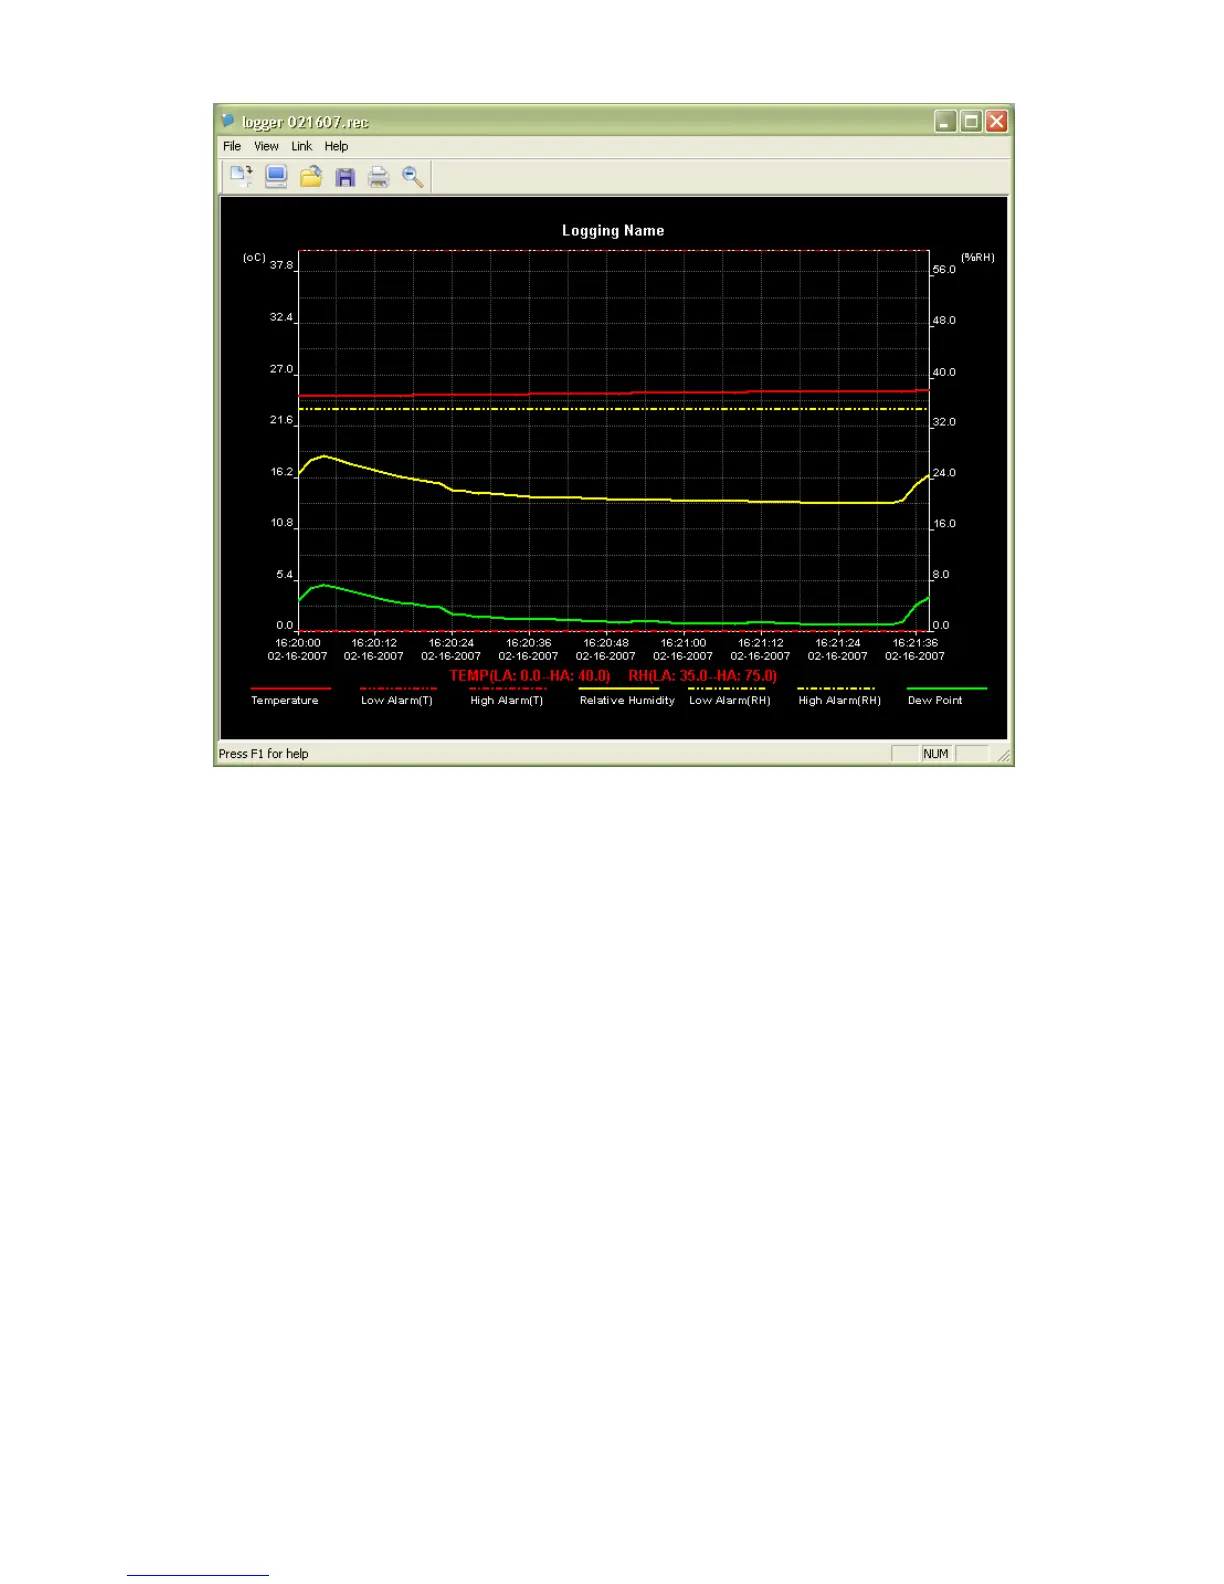
In the example graph above, the Temperature is represented by the
solid red line (the lines are known as ‘traces’), the Relative Humidity
% by the solid yellow trace, and the Dew Point Temperature by the
solid green trace. The low and high alarm values for temperature
are represented by the dashed red trace, the low and high alarm
values for Relative Humidity by the dashed yellow trace.
To customize the graph window select SHOW TRACES,
BACKGROUND, GRID LINES, and MASK POINTS from the VIEW
pull-down menu. These options provide the following features:
SHOW TRACES: Allows the user to select which data to view as a