- –
20
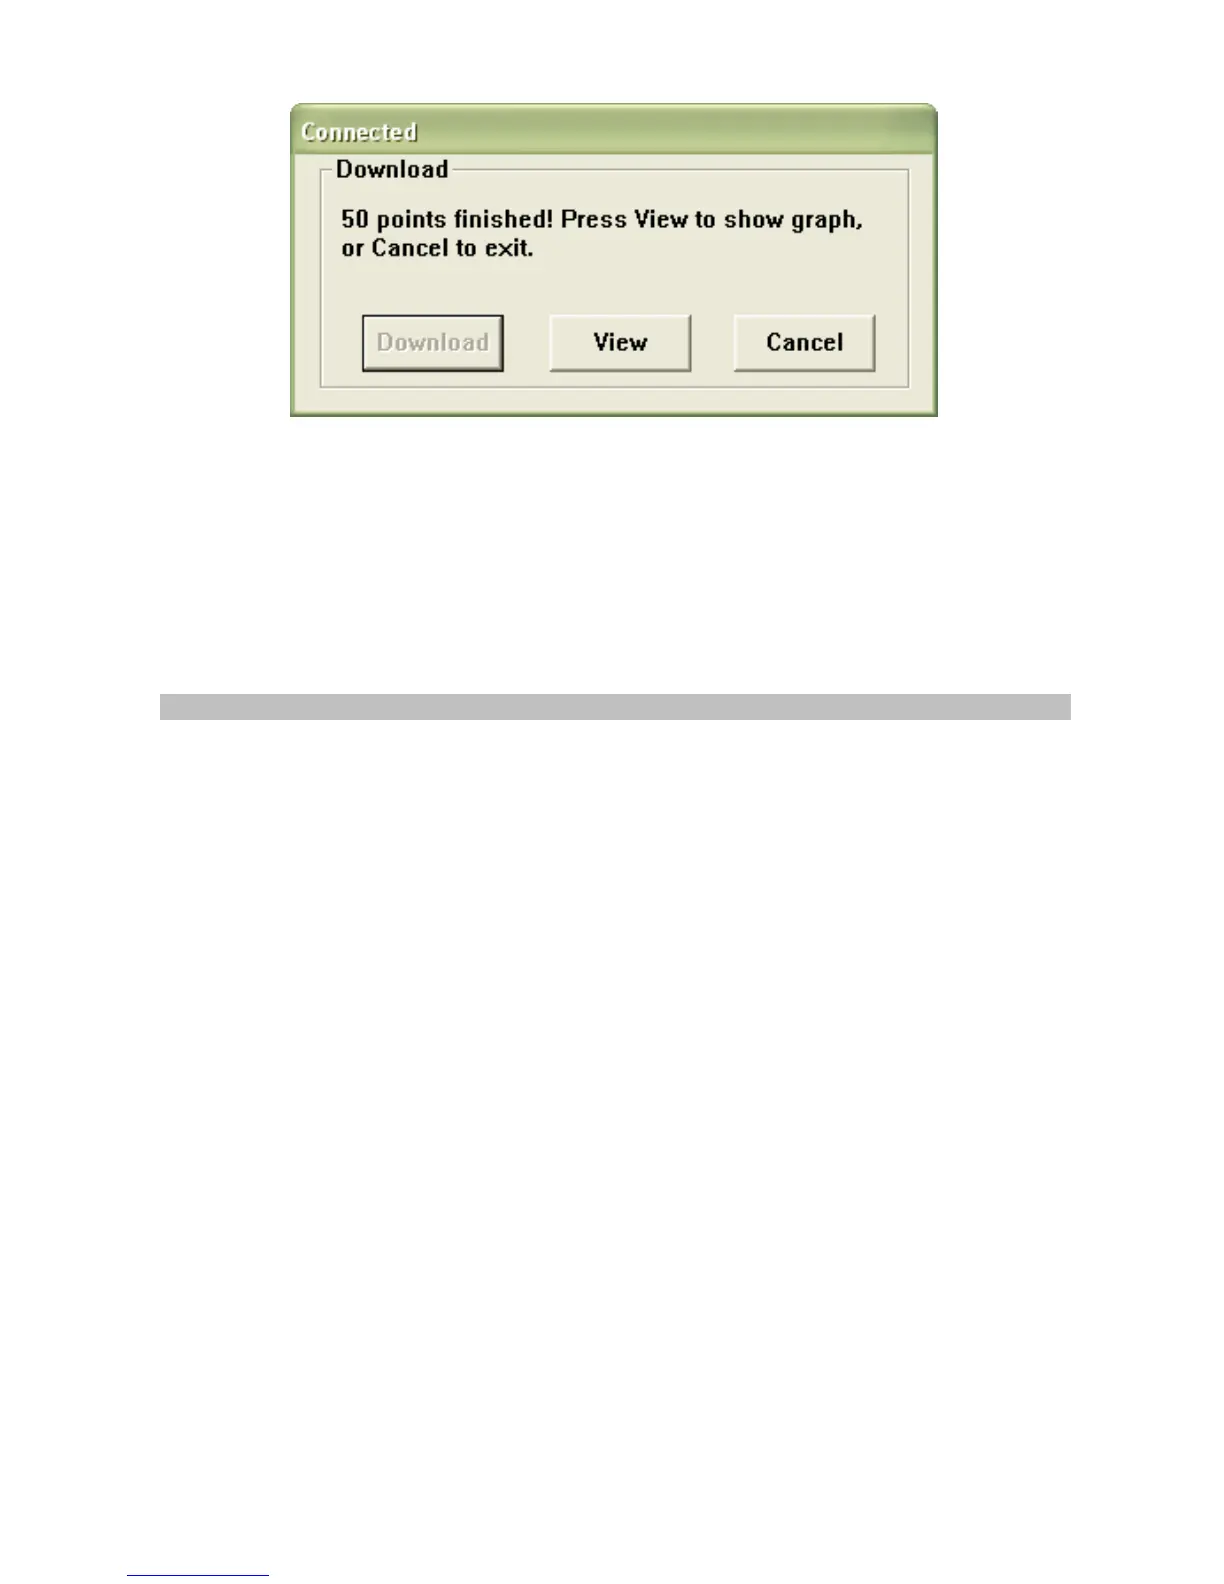
When VIEW is pressed, the Data Graph window appears (pictured
and discussed in the next section)
DATA GRAPH
The Data Graph window presents the transferred data in x-y graph
format with Date/Time represented on the horizontal axis and
Temperature / %Relative Humidity / Dew Point / Alarm Limits
represented on the y axis: