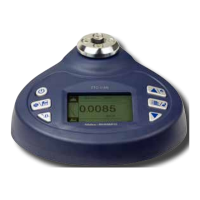
1. LCD SCREEN STANDARD VIEW
Test Mode Icons:
2. Battery Icon: Battery level or charging status. Flashes when
gauge needs to be recharged.
3. OK/OV Preset Indicator:
4. Torque Icons: Indicates force direction.
5. Current measured value
6. Analog Bar: Indicates current position within full scale. When
the bar enters the area enclosed by the dotted line, this
signifies the full scale capacity is exceeded by an overload
condition.
7. Storage Icon: Indicates data is being saved.
8. System time
9. Units Indicator: Selected engineering unit.
10. Statistics X: Average; R: Variance
11. Data list: Five Point Measurement in Peak & First Peak Modes
12. Key Setting Mode: Printer Icon Key press will print. Disc icon
key will store reading.
13. Double Peak Mode Percentages
14. Sensor Icons: TTC-E Only
2
Under Lower Limit
Between Low Limit & Upper Limit
Over Upper Limit
Clockwise (CW)
Counterclockwise (CCW)
Track: Real Time, live measuring mode
Peak: Reading will not change until a higher value is mea-
sured
First Peak: Captures First Peak after a decrease has been
detected. Drop Ratio set in menus.
Auto Peak: Resets Peak after a programmed time period
Auto First Peak: Resets the First Peak after a programmed
time period. First Peak drop Ratio set in menus
Double Peak: Captures two First Peak values. Both drop
ratios set in drop ratio menu
Digital View
Graphic View
1
3
5
9
2
8
7
10
6
4
Preset: Set the upper & lower limit for GO/NG testing
1
2
4
6
7
11
2. MODE DIAGRAM DETAILS
12
12
10% 20%
14
Sensor is Connected
Sensor not Connected
13
www.GlobalTestSupply.com
Find Quality Products Online at: sales@GlobalTestSupply.com