10
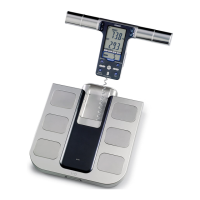
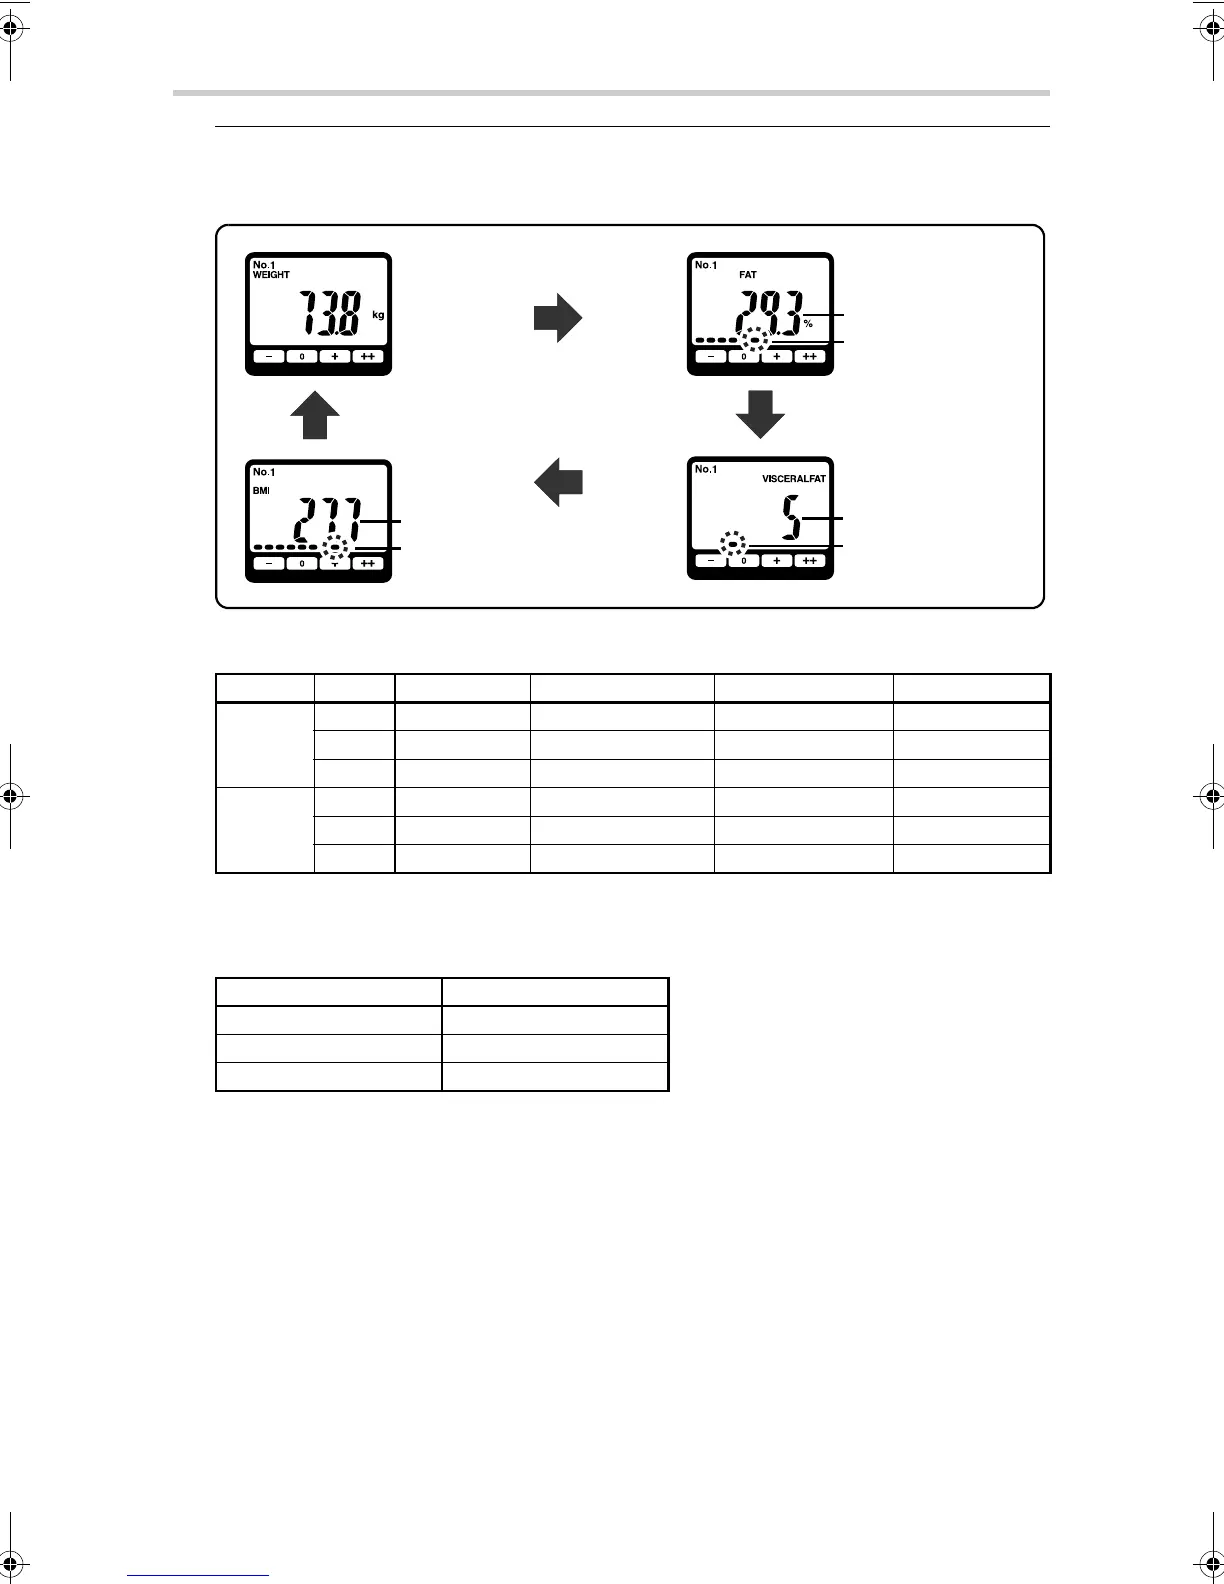
4.Taking a Measurement
5. Check the measurement results.
Press the SET/MODE button to view the desired measurement results. The display changes with each press
of the SET/MODE button as follows: FAT -> VISCERAL FAT -> BMI -> WEIGHT (again)
Interpreting the Body Fat Percentage Result
Based on NIH/WHO guidelines for BMI
Based on Gallagher et al., American Journal of Clinical Nutrition, Vol. 72, Sept. 2000
Interpreting the Visceral Fat Level Result
According to Omron Healthcare figures
Gender Age – (Low) 0 (Normal) + (High) ++ (Very High)
Female
20 - 39
< 21.0% 21.0 - 32.9% 33.0 - 38.9%
39.0%
40 - 59
< 23.0% 23.0 - 33.9% 34.0 - 39.9%
40.0%
60 - 79
< 24.0% 24.0 - 35.9% 36.0 - 41.9%
42.0%
Male
20 - 39
< 8.0% 8.0 - 19.9% 20.0 - 24.9%
25.0%
40 - 59
< 11.0% 11.0 - 21.9% 22.0 - 27.9%
28.0%
60 - 79
< 13.0% 13.0 - 24.9% 25.0 - 29.9%
30.0%
Visceral Fat Level Level Classification
1 - 9
0 (Normal)
10 - 14
+ (High)
15 - 30
++ (Very High)
Body Fat Percentage
Body Fat Percentage
Classification
Visceral Fat Level
Visceral Fat Level
Classification
BMI
BMI Classification
HBF-508-E_main.book 10 ページ 2011年12月28日 水曜日 午後5時11分