Appendix BSpecifications
124
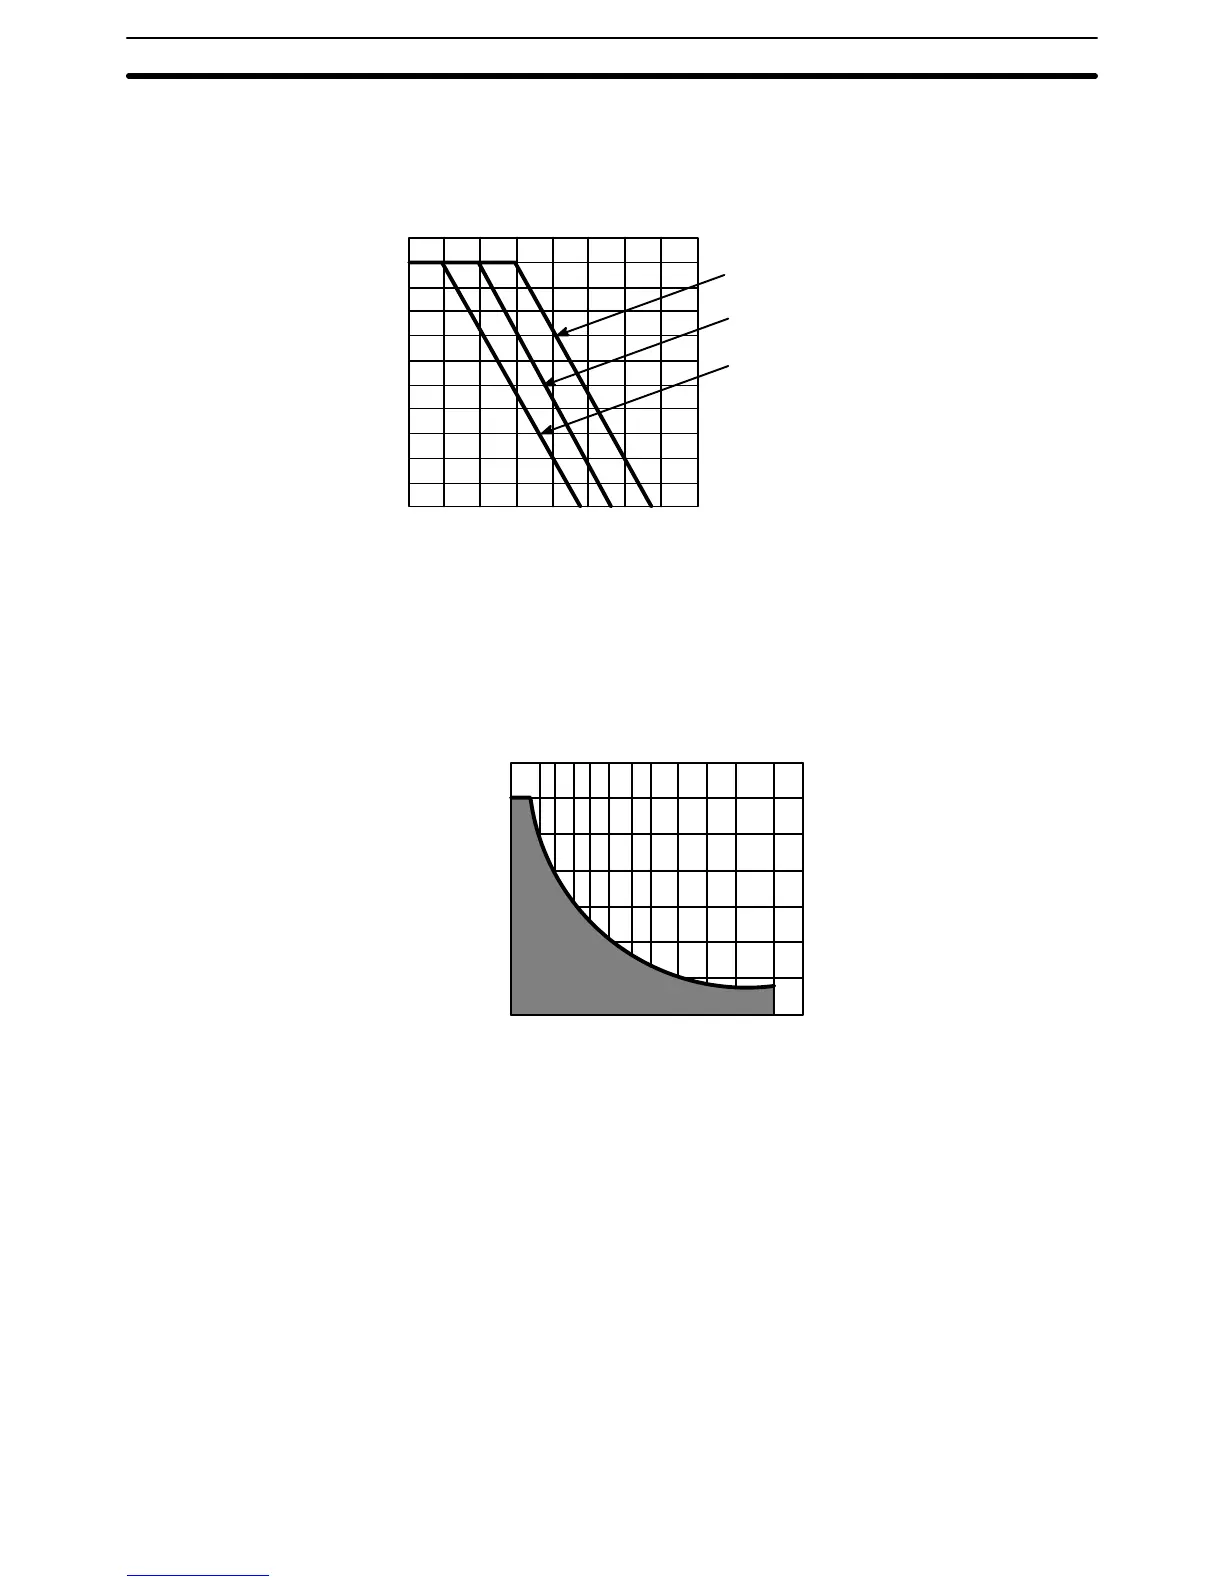
Special Considerations for C500-OA225
The maximum current value allowed per output point depends on the ambient temperature and the number of
points
per common that are ON simultaneously
.
The graph below shows the relationship between the allowable
current
per point and the number of points ON
per common. Be sure not to exceed the values shown in the graph.
1.0
0.8
0.6
0.4
0.2
01 2 3456 78
Current
value
per
point (A)
Number of points per common that
can be turned ON simultaneously.
25°C
40°C
55°C
Environment
temperature
Number of Points per Common Turned ON Simultaneously
The graph below shows the value of the surge current and the time it takes the current to reach a steady state
(current-carrying
time). The curved line in the graph represents
the maximum value of surge current at which the
Unit
can operate properly
. It is suggested that when opening and closing a load with a large surge current, to keep
the value of the surge current to half the value shown the graph (within the shaded area).
0
10
5
15
10 30 50 100 200 500 1,000 5.000
Surge
Current
(A. Peak)
Current-carrying time (ms)
 Loading...