HOW TO TAKE A MEASUREMENT
31
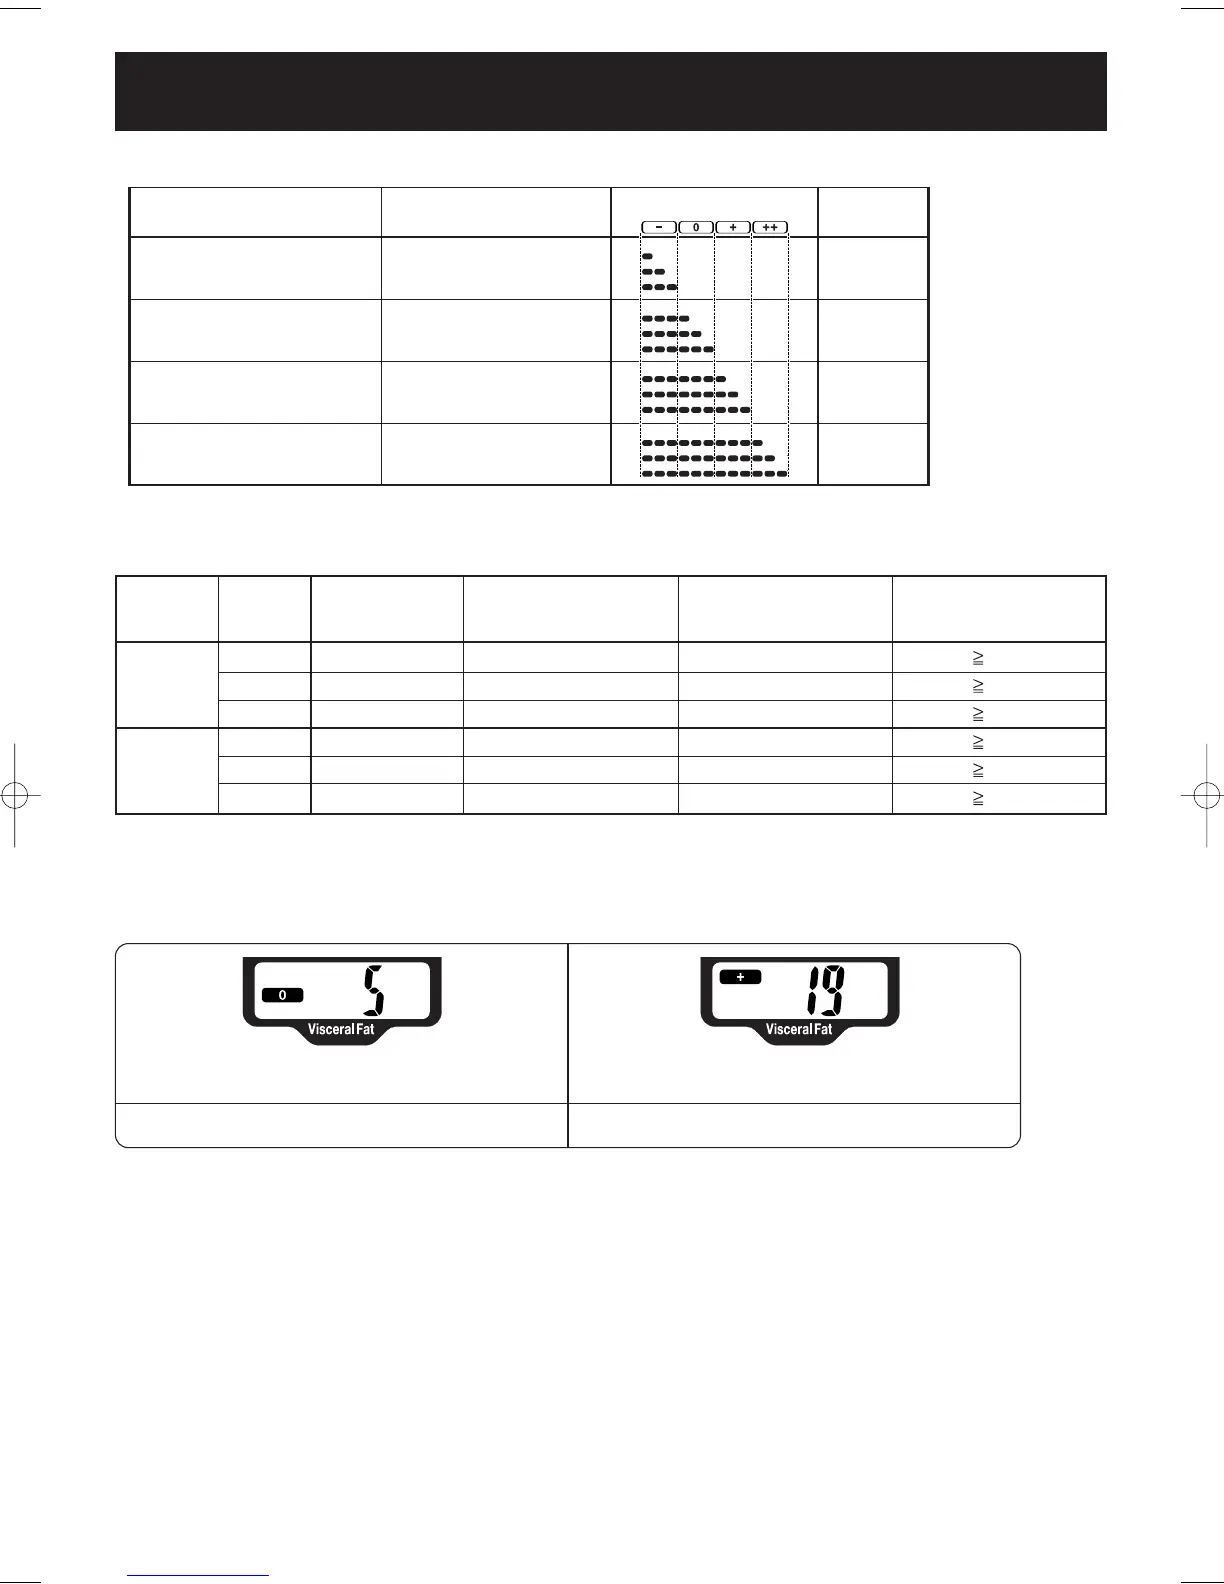
Visceral Fat Level 9
Visceral Fat Level 10
6. Turn the monitor off.
Press the Power Switch to turn the monitor off. Store the Display Unit in the Display Unit
Holder.
0 (Normal)
+ (High)
Interpreting the Visceral Fat Level Result
The above index refers to the values for obesity judgment proposed by WHO, the World Health Organization.
V
iscer
al fa
t ar
ea (0 - Approx. 300 cm
2
,
1 inc
h=2.54 cm) distrib
ution with 30 le
vels.
*
T
he da
ta referenced by Omron Healthcare.
* V
isceral f
at le
v
els are relativ
e and not absolute values.
7.0 - 10.7
1
0.8 - 14.5
1
4.6 - 18.4
1
8.5 - 20.5
2
0.6 - 22.7
22.8 - 24.9
25.0 - 26.5
26.6 - 28.2
28.3 - 29.9
30.0 - 34.9
35.0 - 39.9
40.0 - 90.0
Less than 18.5
18.5 or more and less than 25
25 or more and less than 30
30 or more
-
(Underweight)
0 (Normal)
+ (Overweight)
++ (Obese)
B
MI
BMI (Designation by the WHO)
BMI Classification Bar
BMI Rating
Interpreting the BMI Result
Based on NIH/WHO guidelines for BMI
Based on Gallagher et al., American Journal of Clinical Nutrition, Vol. 72, Sept. 2000
Female
Male
Age
20-39
40-59
60-79
20-39
40-59
60-79
Low (–)
< 21.0
< 23.0
< 24.0
< 8.0
< 11.0
< 13.0
Normal
(0)
21.0 - 32.9
23.0 - 33.9
24.0 - 35.9
8.0 - 19.9
11.0 - 21.9
13.0 - 24.9
High
(+)
Very High
(++)
33.0 - 38.9
34.0 - 39.9
36.0 - 41.9
20.0 - 24.9
22.0 - 27.9
25.0 - 29.9
39.0
40.0
42.0
25.0
28.0
30.0
Gender
Interpreting the Body Fat Percentage Result
HBF-500 for FDA 10-26.qxd 10/26/06 4:21 PM Page 31