10
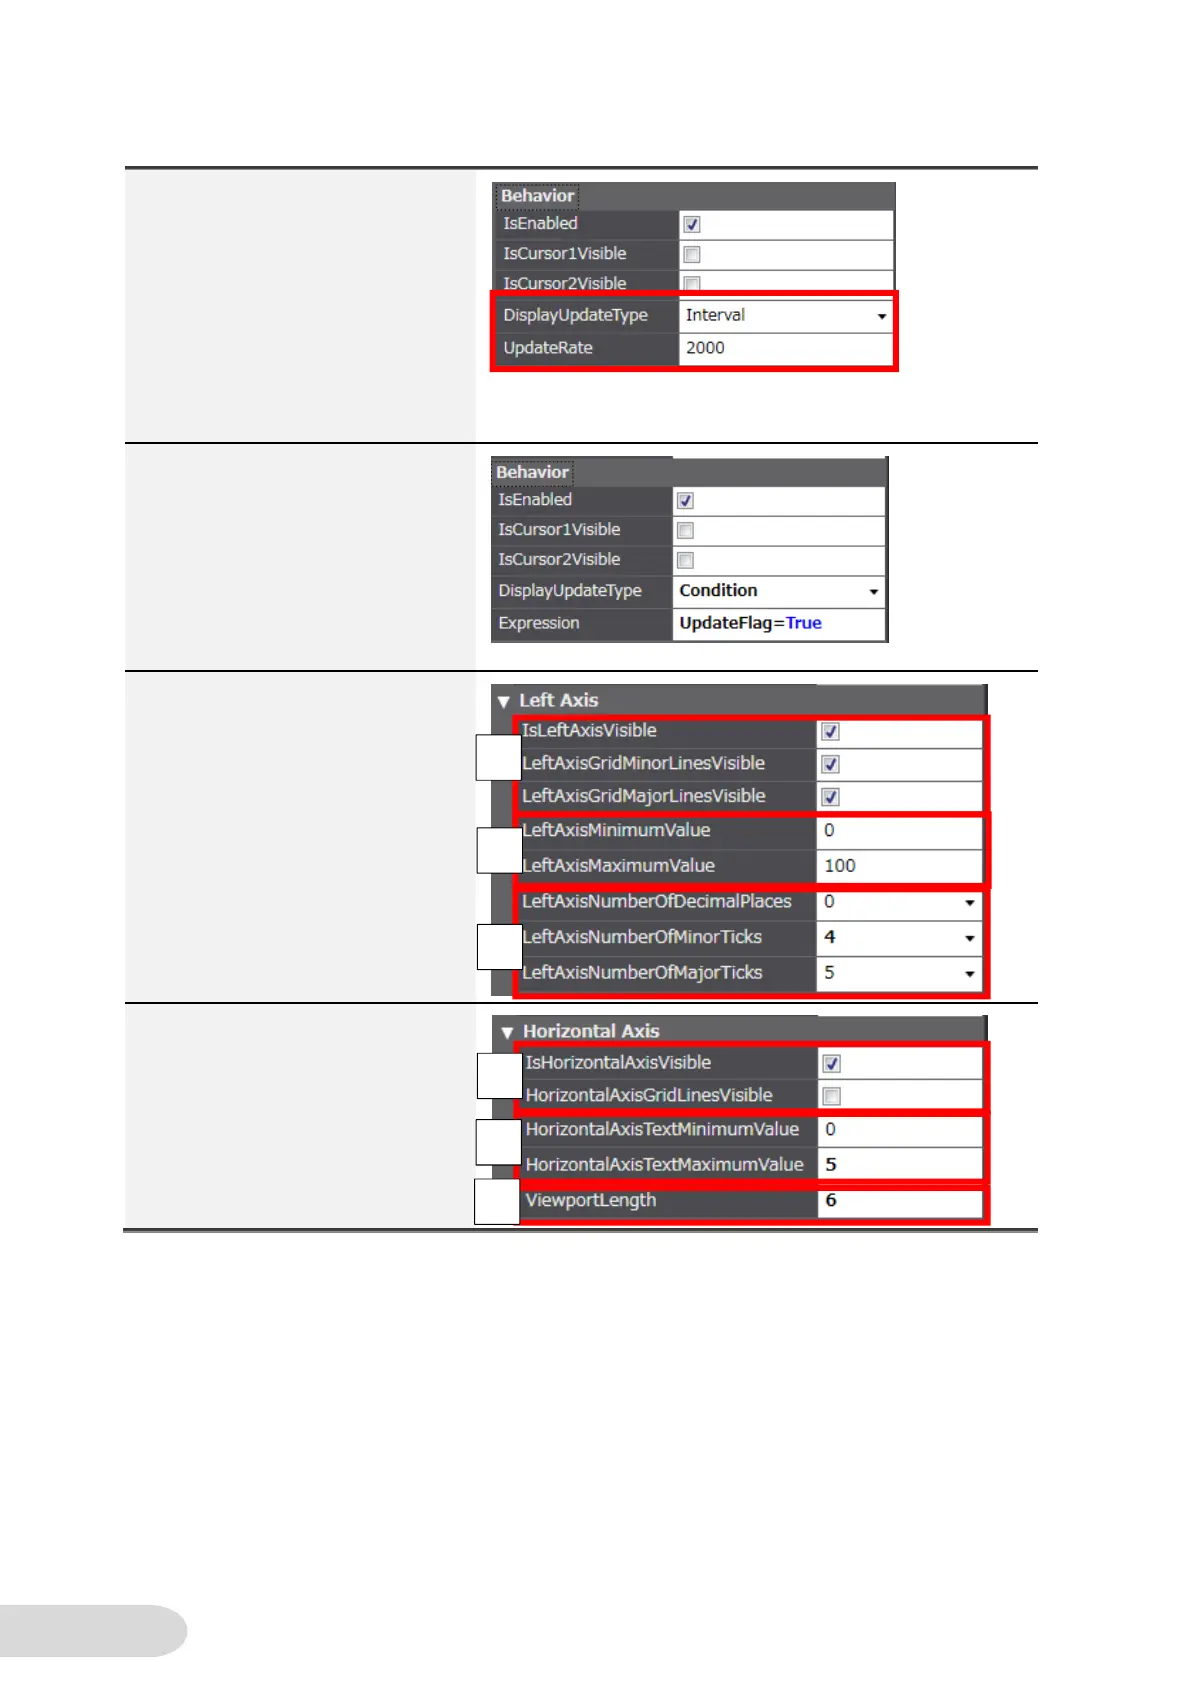
5. Specify the timing for the graph to
be updated. You can select from
among two options: to update at a
constant interval, or to update
when a variable condition is met.
If you select “Interval” in
[DisplayUpdateType] under
[Behavior] in the Properties, the
graph display is updated at the
interval specified in [UpdateRate]
(unit: msec.).
6. If you select “Condition” under
[DisplayUpdateType] under
[Behavior] in the Properties, the
graph display is updated when
the condition specified in
[Expression] is met. In the
example shown on the right, the
display is updated when
UpdateFlag is turned ON.
7. Edit the vertical axis of the graph
as below:
1. Specify whether to display the
axis, major grid lines, and minor
grid lines.
2. Specify the maximum and
minimum values of the axis.
3. Specify the number of decimal
places of the axis values and the
number of ticks of the axis.
The figure on the right shows the
fields for the left axis. There are
the same fields for the right axis.
8. Edit the horizontal axis of the
graph as below:
1. Specify whether to display the
values and grid lines.
2. Specify the maximum and
minimum values of the axis.
3. Specify how many traces are
to be displayed within a graph.
1.
2.
3.
1.
2.
3.
 Loading...