9
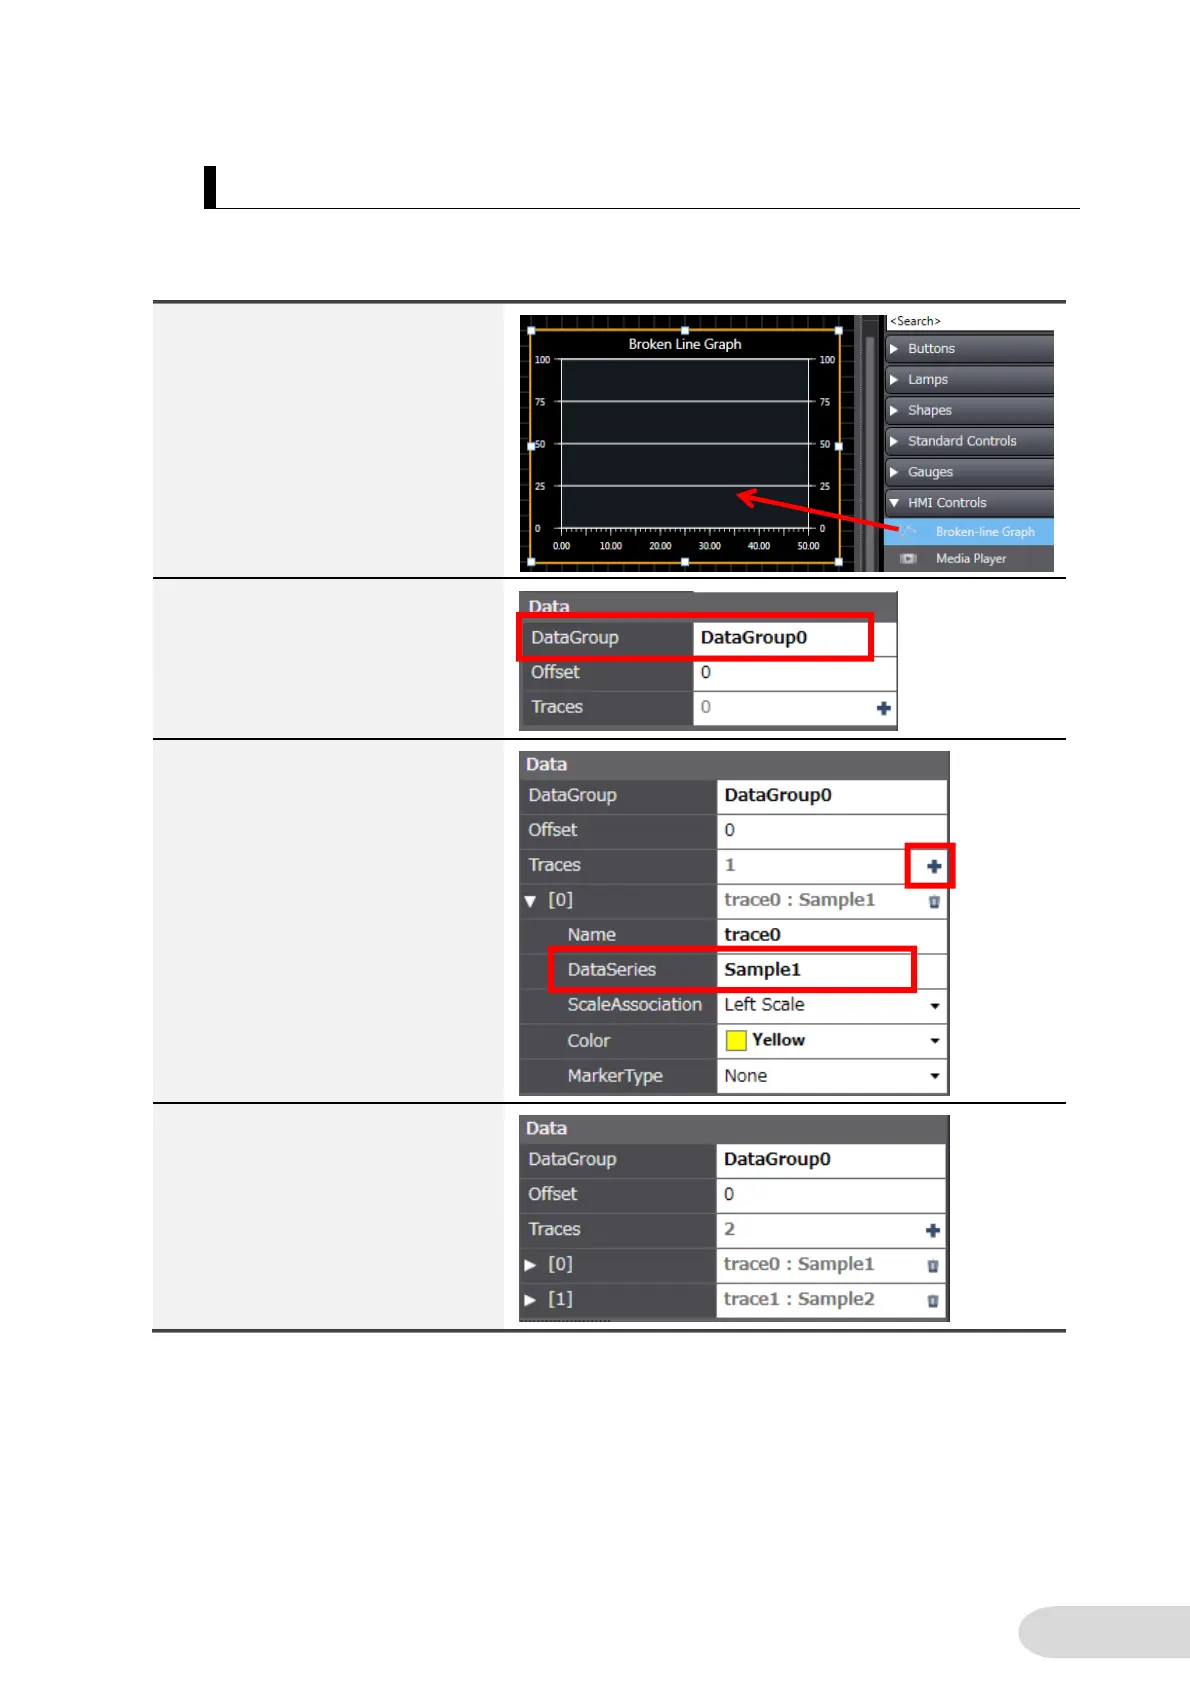
1-1-2 Setting the Properties of a Broken-line Graph Object
Perform settings for displaying as a graph the data group specified in the previous
subsection.
1. From [Toolbox], select [HMI
Controls]-[Broken-line Graph]
and drag and drop it to the page.
2. In [DataGroup] under [Data] in
the Properties, enter the name of
the data group created in the
previous subsection.
3. When you click the [+] of the
[Traces] cell, the setting fields
appear under [0]. Register in
[DataSeries] the name of the data
series to be displayed in the
graph.
4. Repeat Step 3 the number of
times of the data (i.e. the number
of lines) to be displayed in the
graph.
 Loading...