GFPIII operation manual Opti-Sciences, Inc.
Re-absorption of the emitted chlorophyll fluorescence by the leaf chlorophylls:
Chlorophyll fluorescence emission can be re-absorbed by other chlorophyll and re-emitted as additional
fluorescence. While this is a relatively small error source in the F735nm / F700 ratio, re-absorbance when
other ratio components have been tried, such as 685 nm and 690 nm wavelengths, have limited the
reliability of chlorophyll measurement to below 200 mg m-2 according to Gitelson (1999). The F735nm /
F700 ratio, on the other hand, has been shown to be linear from 41 mg m
-2
to 675 mg m
-2
. Because 700 is
relatively far from the chlorophyll absorption peak at 680 nm, the re-absorption issue is minimized.
Furthermore, since longer excitation wavelengths reach deeper into the leaf, causing greater fluorescence
re-absorption, the CCM-300 uses a 460nm diode for fluorescence excitation, and as a result, most
fluorescence comes from mesophyll cells and re-emitted fluorescence is minimized (Gitelson 1999).
Temperature:
Buschmann reports that the ratio of F690/F735 (a similar ratio but not F735/F700) can drop by up to 25%
as temperatures drop from 23
o
C to 4
o
C. This is thought to be influenced by state transitions, and PSI
fluorescence. This shows that the instrument can be used for plant stress measurement, but it also shows
that for direct chlorophyll content comparison measurement applications, temperature differences should
be considered when comparing samples.
When using the CCM-300 with white pine needles, the measured ratio was 1.72 at 20
o
C using an average
of ten measurements. At 3
o
C, the measurements dropped to 1.68 with an average of ten measurements
(data not shown).
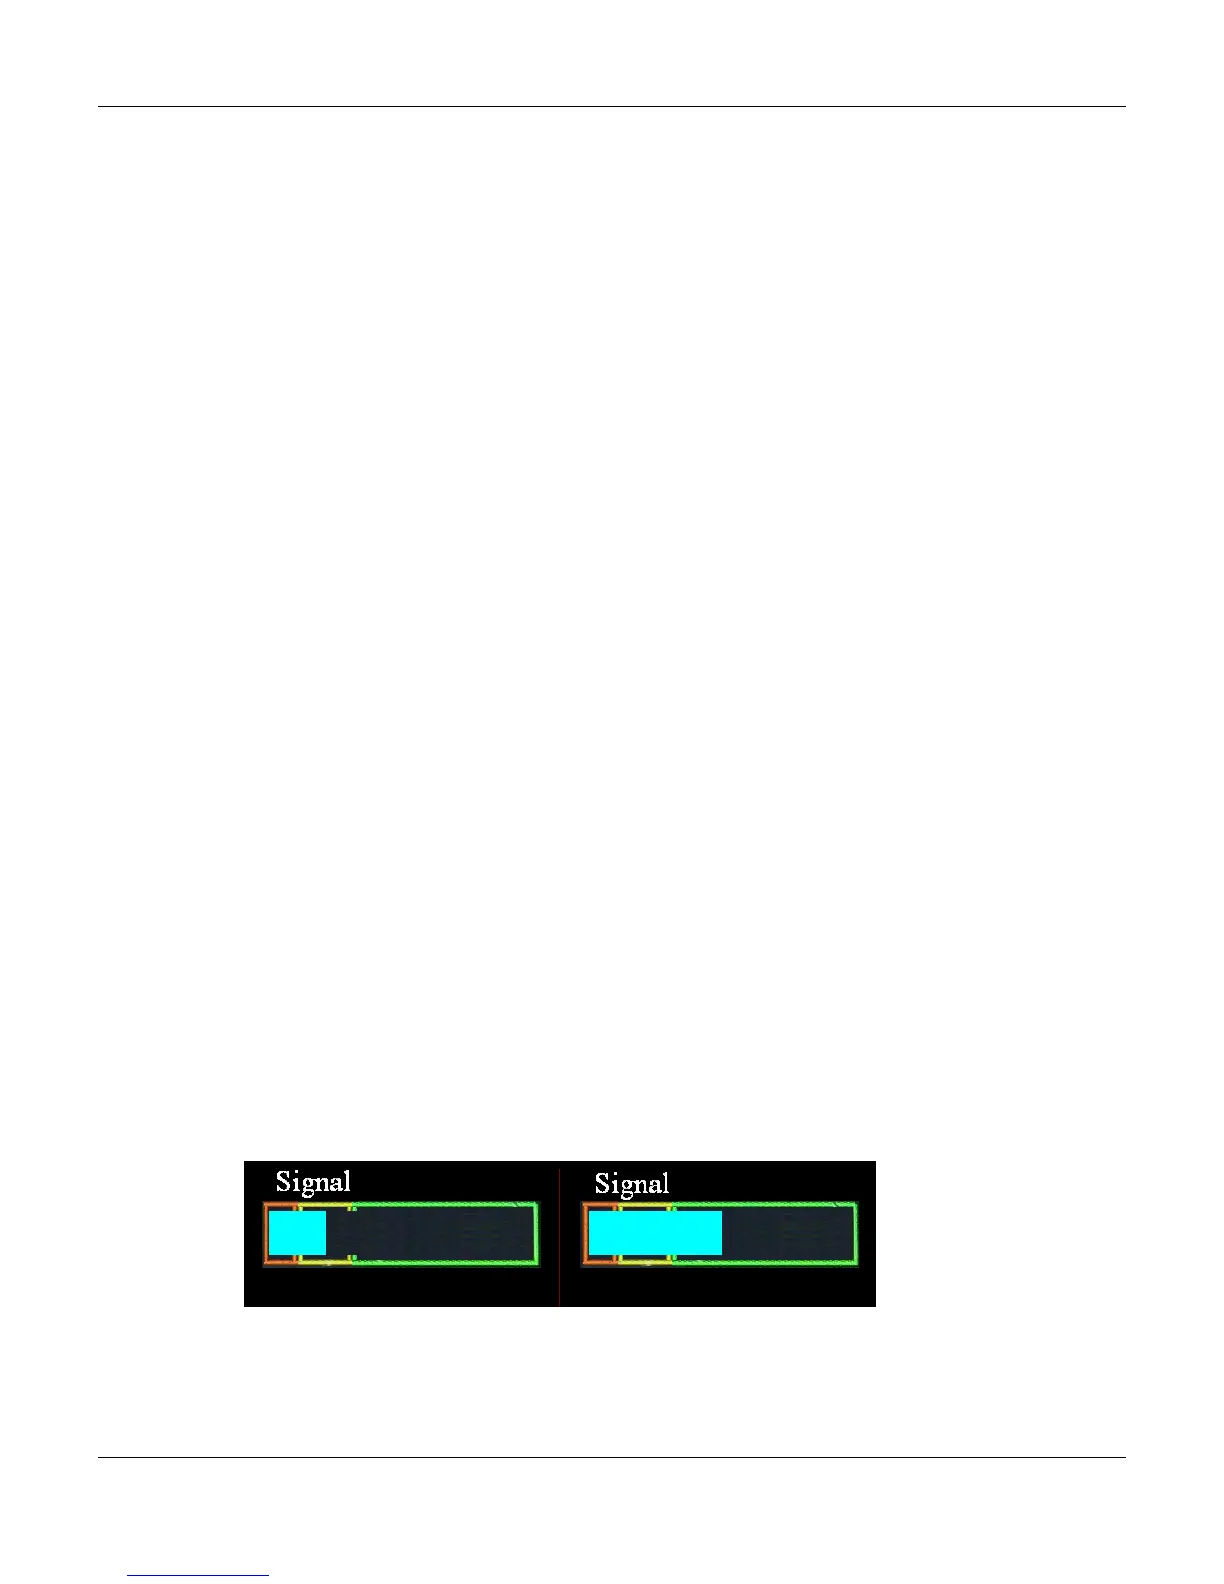
Fluorescence emission signal strength:
It has been found that measurement variation is effected by fluorescence emission signal strength. A
special signal strength color gauge is provided on the bottom of the measuring screen. If the signal is in
the green range the variation is less, and if it is in the yellow range it is more. Samples with lower signal
strength such as individual white pine needles may require multiple measurements and measurement
averaging to provide the most reliable results.
Yellow signal range Green signal range
10