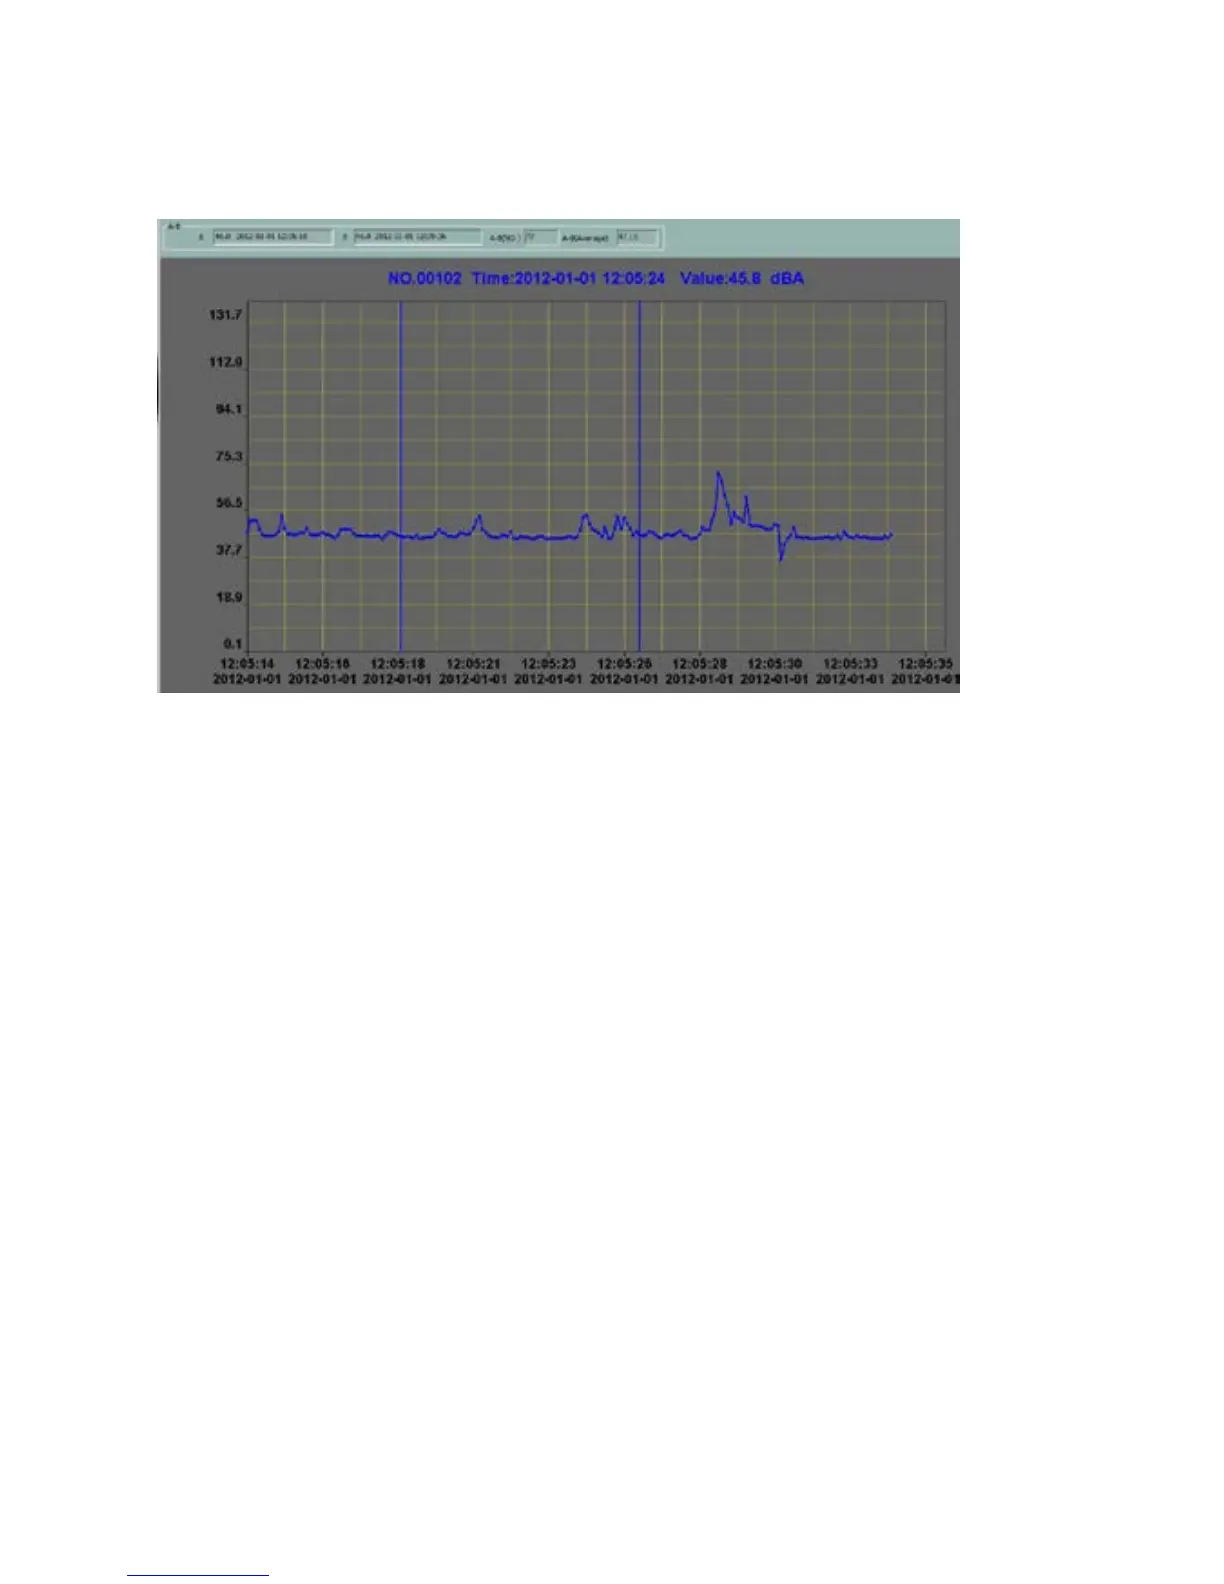
EasyManuals Logo

PCE Instruments PCE-322A User Manual

PCE Instruments PCE-322A
29 pages
To Next Page IconTo Next Page
To Previous Page IconTo Previous Page
Page #24 background imageLoading...
Page #24 background image
(3) A-B Graph
Double-click the left mouse button on the curve interface, and
then click to select intervals shown in the figure above,
Form A-B will show the start time, start value, end time, end value,
and the amount and average value between the selected points.
Right-click is to cancel this function;
(4) Datalogger Function
SETUP

Other manuals for PCE Instruments PCE-322A

Questions and Answers:

Question and Answer IconNeed help?

Do you have a question about the PCE Instruments PCE-322A and is the answer not in the manual?

PCE Instruments PCE-322A Specifications

General IconGeneral
BrandPCE Instruments
ModelPCE-322A
CategoryData Loggers
LanguageEnglish

Related product manuals