PENNBARRY
13
P Series Fan Curves
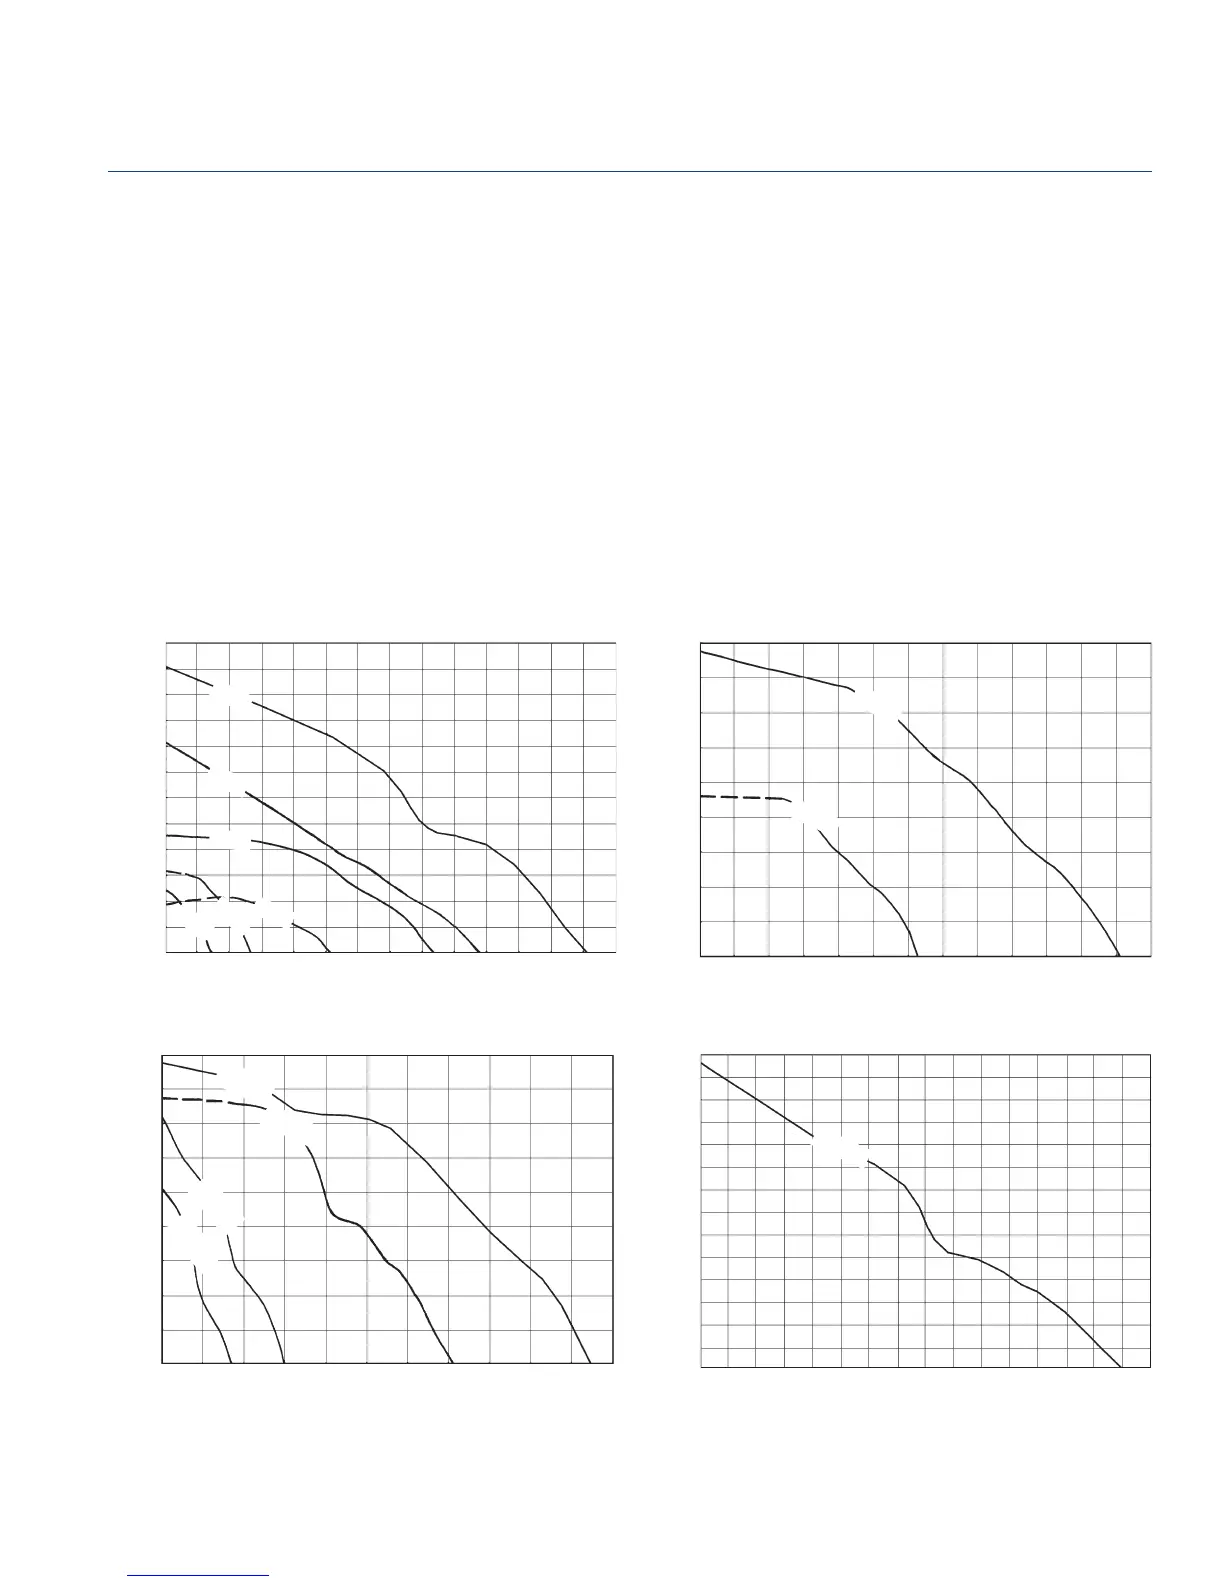
The fan curves illustrated here show the range of capacities
available for P series direct drive units. Each graph shows
the performance of several models at one particular nominal
speed. Fan curves provide a quick method for selecting a fan
unit based on design point requirements.
The direct drive performance chart on the previous page
provides the tabular data (CFM and static pressure) used to
plot the fan curves. In addition, horsepower, tip speed and
sones are tabulated. Since sound is normally an important
factor in the selection of a fan, an engineer will usually
want to select the “slowest” unit which meets CFM and SP
requirements.
Please refer to the Motor Selection section to make sure the
motor you select meets your electrical requirements.
Note: Breezeway fans are only one component of a total
system. As such, fan performance is directly affected by the
system. It is critical that system designers determine the actual
system loss to ensure that the actual fl ow is specifi ed in the
system design.
Do not select in dashed portion of curves. These regions are not shown in the tabular data.
1300 RPM
0.900
0.800
0.700
0.600
0.500
0.400
0.300
0.200
0.100
0.000
STATIC PRESSURE - INCHES W.G.
0 1000 2000 3000 4000 5000 6000
AIR FLOW - CFM
P20SA
P16SA
1650 RPM
1.400
1.300
1.200
1.100
1.000
0.900
0.800
0.700
0.600
0.500
0.400
0.300
STATIC PRESSURE - INCHES W.G.
0.200
0.100
0.000
0 1000 2000 3000 4000
AIR FLOW - CFM
P16Q1A
1550 RPM
0.900
0.800
0.700
0.600
0.500
0.400
0.300
0.200
0.100
0.000
STATIC PRESSURE - INCHES W.G.
0 1000 2000 3000 4000 5000
AIR FLOW - CFM
P18RA
P16RA
P10RA
P12RA
1050/1140 RPM
1.200
1.100
1.000
0.900
0.800
0.700
0.600
0.500
0.400
0.300
0.200
0.100
0.000
STATIC PRESSURE - INCHES W.G.
0 1000 2000 3000 4000 5000 6000 7000
AIR FLOW - CFM
P24VA
P20TA
P18VA
P16VA
P10VA
P12VA
Direct Drive Fan Data
Breezeway