PENNBARRY
42
If the system resistance has been underestimated, then fan
curves and system curves will not intersect at the system
design point. They will intersect at lower CFM (point B). If the
system resistance has been overestimated, then the fan curve
system curve will intersect at a higher CFM than the system
design point (point C). (See Figure 1)
Effect of Change in Density, Altitude and Temperature
Correction Factors
The resistance of a duct system is dependent upon the density
of the gas fl owing through the system. A gas density of 0.075
lb/ft
3
is standard in the fan industry.
Pressure and horsepower vary directly as the ratio of the gas
density at the fan inlet to standard density. This density ratio
must always be considered when selecting fans. To select
a fan, pressure should be corrected to standard air density,
0.075 lb/ft
3
, 70ºF. at sea level. Static pressure at operating
condition x correction factor=static pressure at standard.
Refer to Table 1.
Table 1
Correction Factors
Unity Basis = Standard Air Density of 0.075 lb/ft
3
At sea level (29.92 in. Hg barometric pressure) this is equivalent to
dry air at 70°F.
Horsepower at standard ÷ correction factor = horsepower at
operating condition. Motors should be sized for highest density
conditions at which it is expected to operate.
Inlet System Effect
The most common installation problem is ductwork connection
to the inlet side of the fan. Here are several design criteria
for connecting ductwork to the fan. Keep a straight duct run
twice the diameter of the inlet size immediately before the
inlet of the fan. This will give the air a chance to straighten
out before entering the fan. Fan inlet swirl and non-uniform
inlet fl ow can often be corrected by inlet straightening vanes
or guide vanes. Restricted fan inlets located too close to walls,
obstructions or restrictions caused by a plenum or cabinet, will
decrease the useable performance of a fan. Cabinet clearance
effect or plenum effect must be considered a component
part of the entire system; the pressure losses through the
cabinet or plenum effect is considered as a System Effect
when determining system characteristics. The backdraft
Figure 2
CURVE B - ACTUAL DUCT
SYSTEM WITH SYSTEM
EFFECT
CURVE A - CALCULATED DUCT
SYSTEM WITH NO ALLOWANCE
FOR SYSTEM EFFECT
SYSTEM EFFECT LOSS AT
DESIGN VOLUME
FAN CATALOG
PRESSURE-VOLUME
CURVE
SYSTEM
EFFECT AT
ACTUAL
FLOW
VOLUME
DEFICIENT
PERFORMANCE
Defi cient Fan/Duct System Performance System Effect Ignored
DESIGN VOLUME
DESIGN PRESSURE
TEMP
ºF
ALTITUDE (FEET) WITH BAROMETRIC PRESSURE (Inches Hg)
0' 500' 1000' 1500' 2000' 2500' 3000' 3500' 4000' 4500' 5000'
29.92 29.38 28.86 28.33 27.82 27.31 26.82 26.32 25.84 25.36 24.9
- 40 0.79 0.81 0.82 0.84 0.85 0.87 0.88 0.9 0.92 0.93 0.95
0 0.87 0.88 0.9 0.92 0.93 0.95 0.97 0.99 1 1.02 1.04
40 0.94 0.96 0.98 1 1.01 1.03 1.05 1.07 1.09 1.11 1.13
70 1 1.02 1.04 1.06 1.08 1.1 1.12 1.14 1.16 1.18 1.2
80 1.02 1.04 1.06 1.08 1.1 1.12 1.14 1.16 1.18 1.2 1.22
100 1.06 1.08 1.1 1.12 1.14 1.16 1.18 1.2 1.22 1.25 1.27
damper is part of external static pressure, and should be
accounted for when estimating system static pressure. Use
a motorized backdraft damper when the fan has a variable
speed controller.
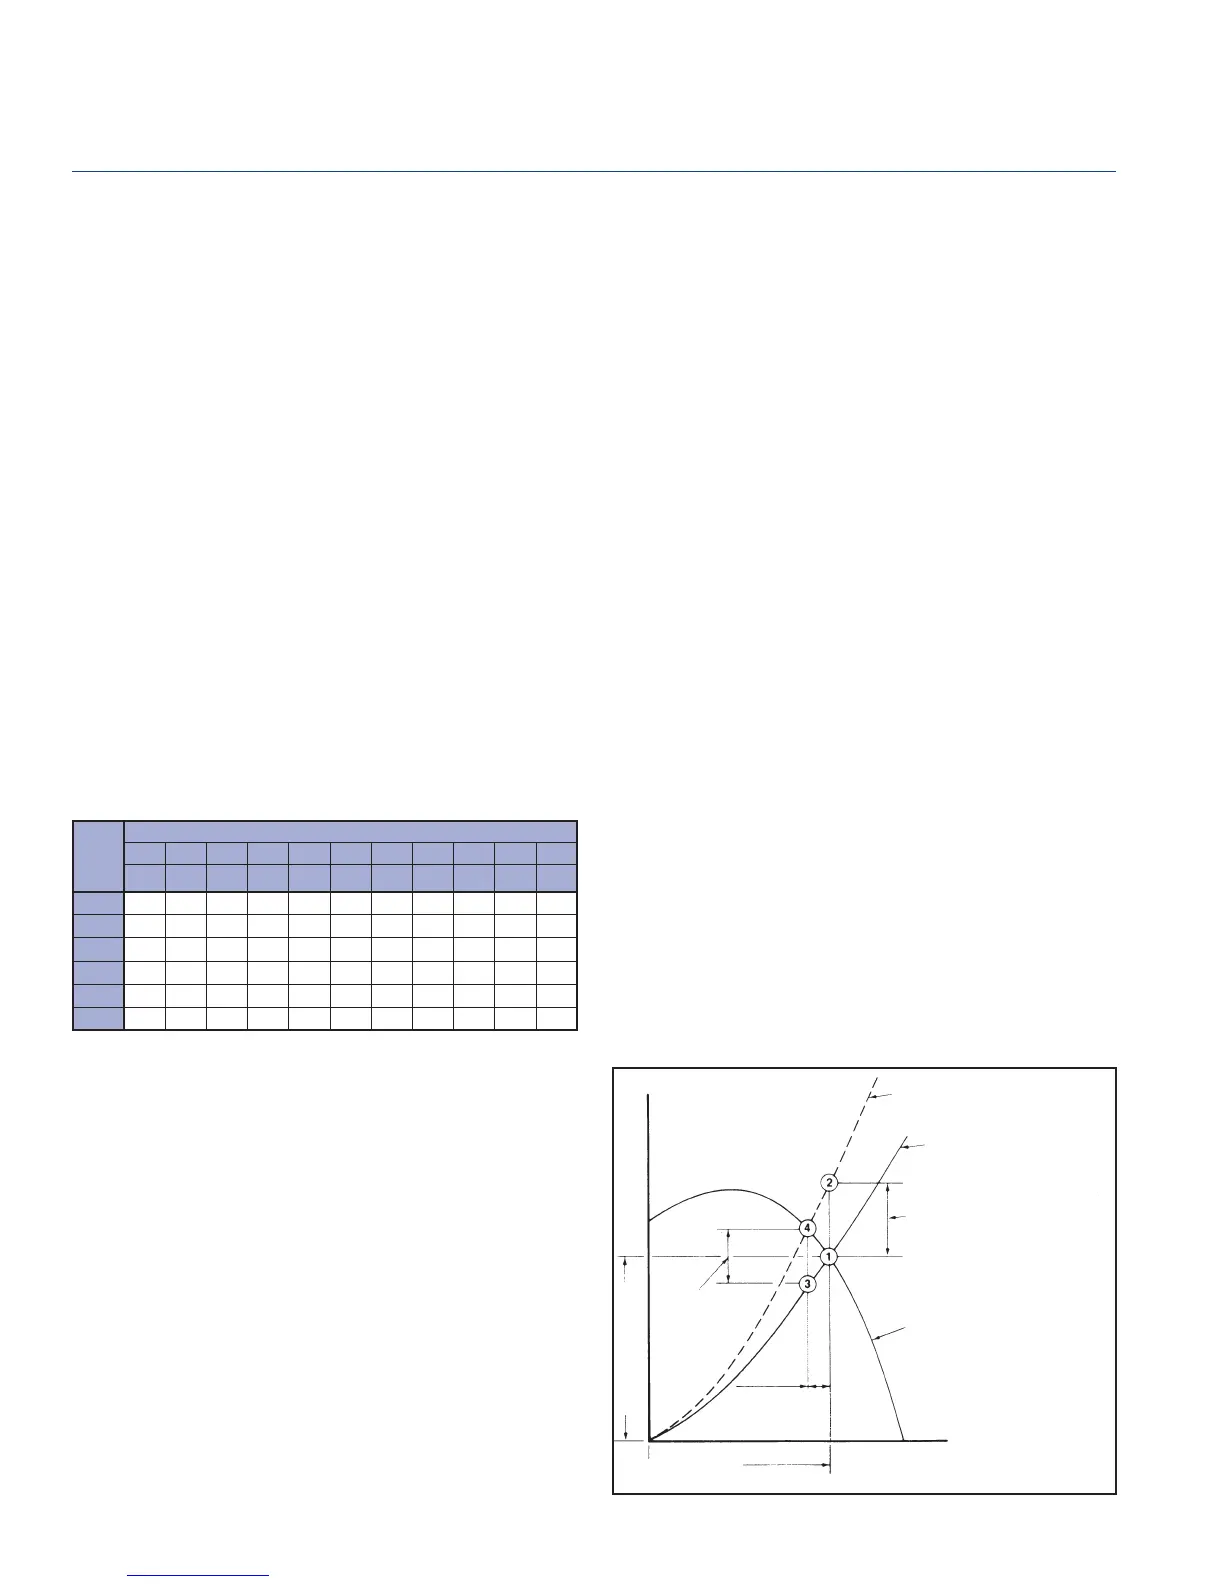
System Effect
A System Effect Factor is a pressure loss which recognizes
the effect of fan inlet restrictions, fan outlet restrictions or other
conditions infl uencing fan performance when installed in the
system. Figure 2 illustrates defi cient fan/system performance
resulting from one or more undesirable fl ow conditions. It is
assumed that the system pressure losses, shown in system
curve A, have been accurately determined, and a suitable fan
selected for operation at Point 1. However, no allowance has
been made for the effect of the system connections on the
fan’s performance. To compensate for this System Effect, it
will be necessary to add a System Effect Factor (SEF) to the
calculated system pressure losses to determine the actual
system curve. The SEF for any given confi guration is velocity
dependent and will, therefore, vary across the range of fl ow
volumes for the fan.
In Figure 2, the point of intersection between the fan
performance curve and the actual system curve B is Point
4. The actual fl ow volume will, therefore, be defi cient by the
difference from 1-4. To achieve design fl ow volume, an SEF
equal to the pressure difference between Point 1 and 2 should
have been added to the calculated system pressure losses and
the fan selected to operate at Point 2. Note that because the
System Effect is velocity related, the difference represented
between Points 1 and 2 is greater than the difference between
Points 3 and 4.
The SEF includes only the effect of the system confi guration
on the fan’s performance.
Engineering Notes
Breezeway
 Loading...