given time. Mouse over any line on the graph to see how many clients
connected to a specific SSID for that point in time.
This graph enables you to see the data usage of any SSID for any given time
period. Mouse over any line on the graph to see the data usage by each SSID
for that point in time. Use the buttons next to Zoom to select the time scale you
wish to view. In addition, you could use the sliders at the bottom to further refine
your timescale.
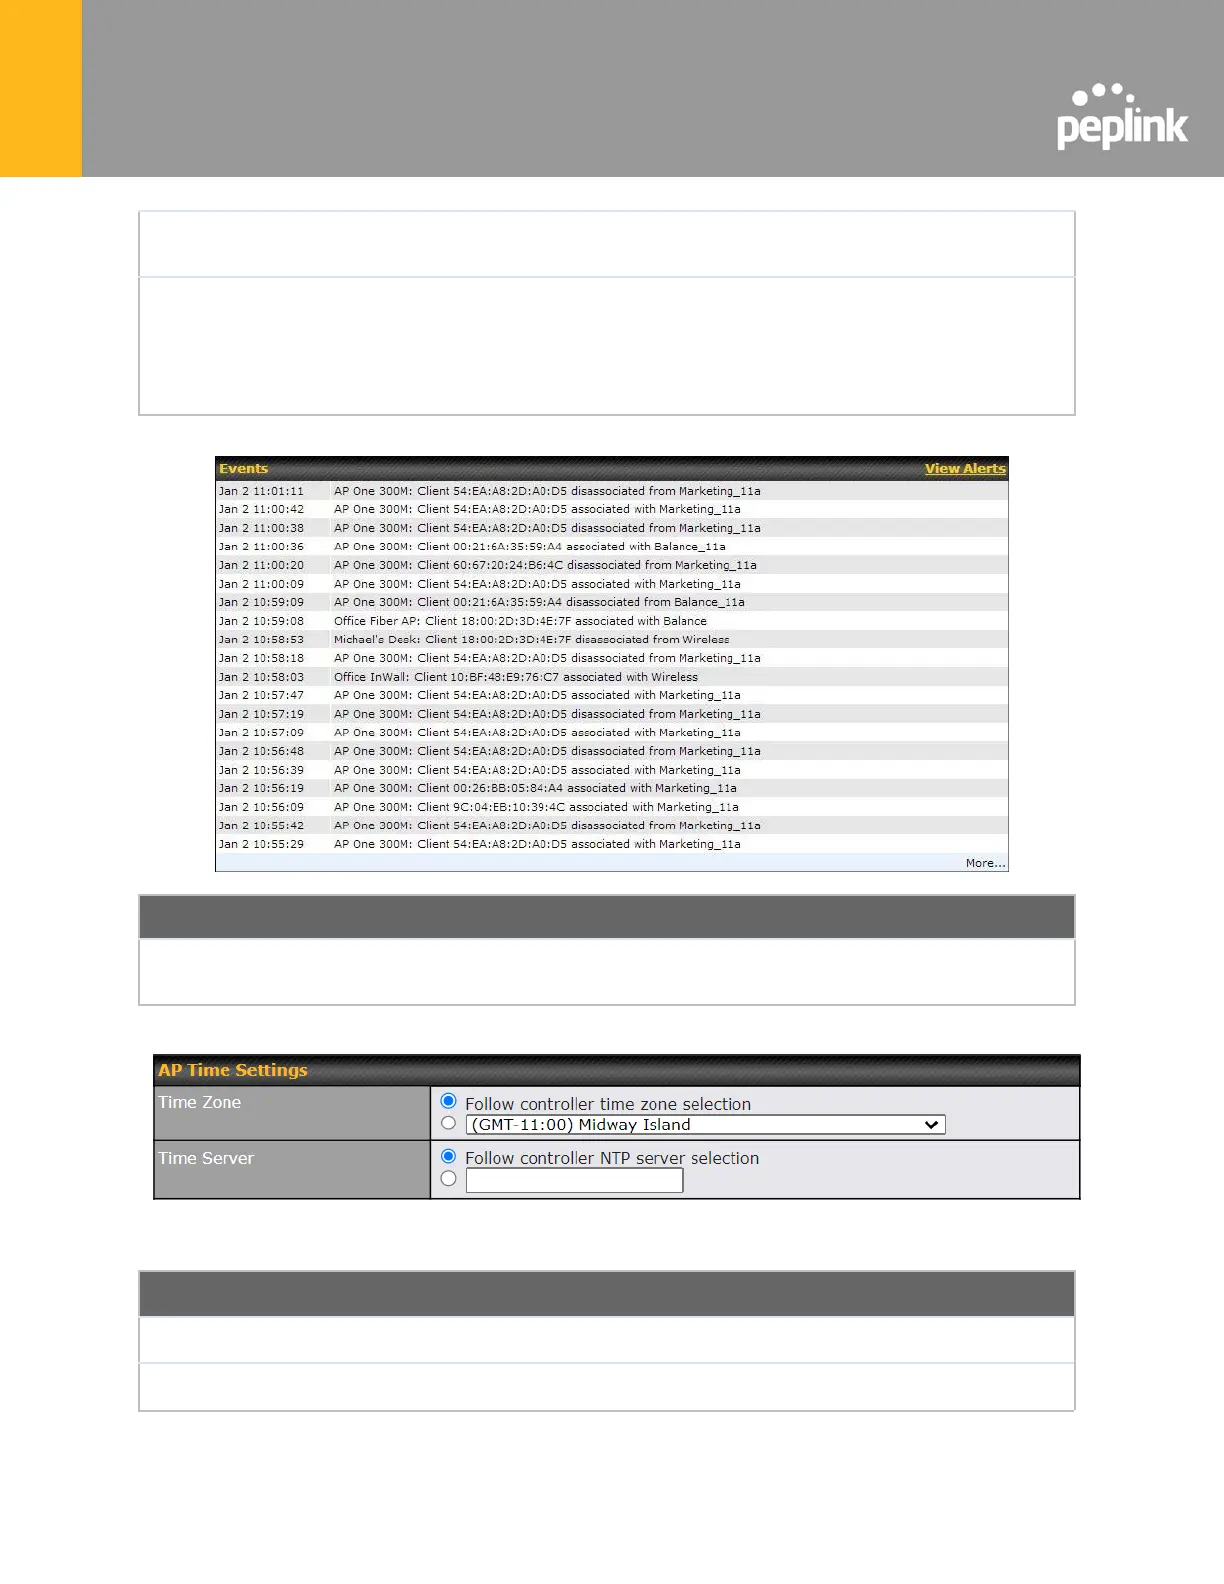
This event log displays all activity on your AP network, down to the client level. Click View Alerts to see
only alerts, and click the More… link for additional records.
This allow user to configure AP Time Settings (both Timezone and NTP) in AP Controller.
Ths field is to select the time zone for the AP controller.
Ths field is to select the time server for the AP controller.
 Loading...