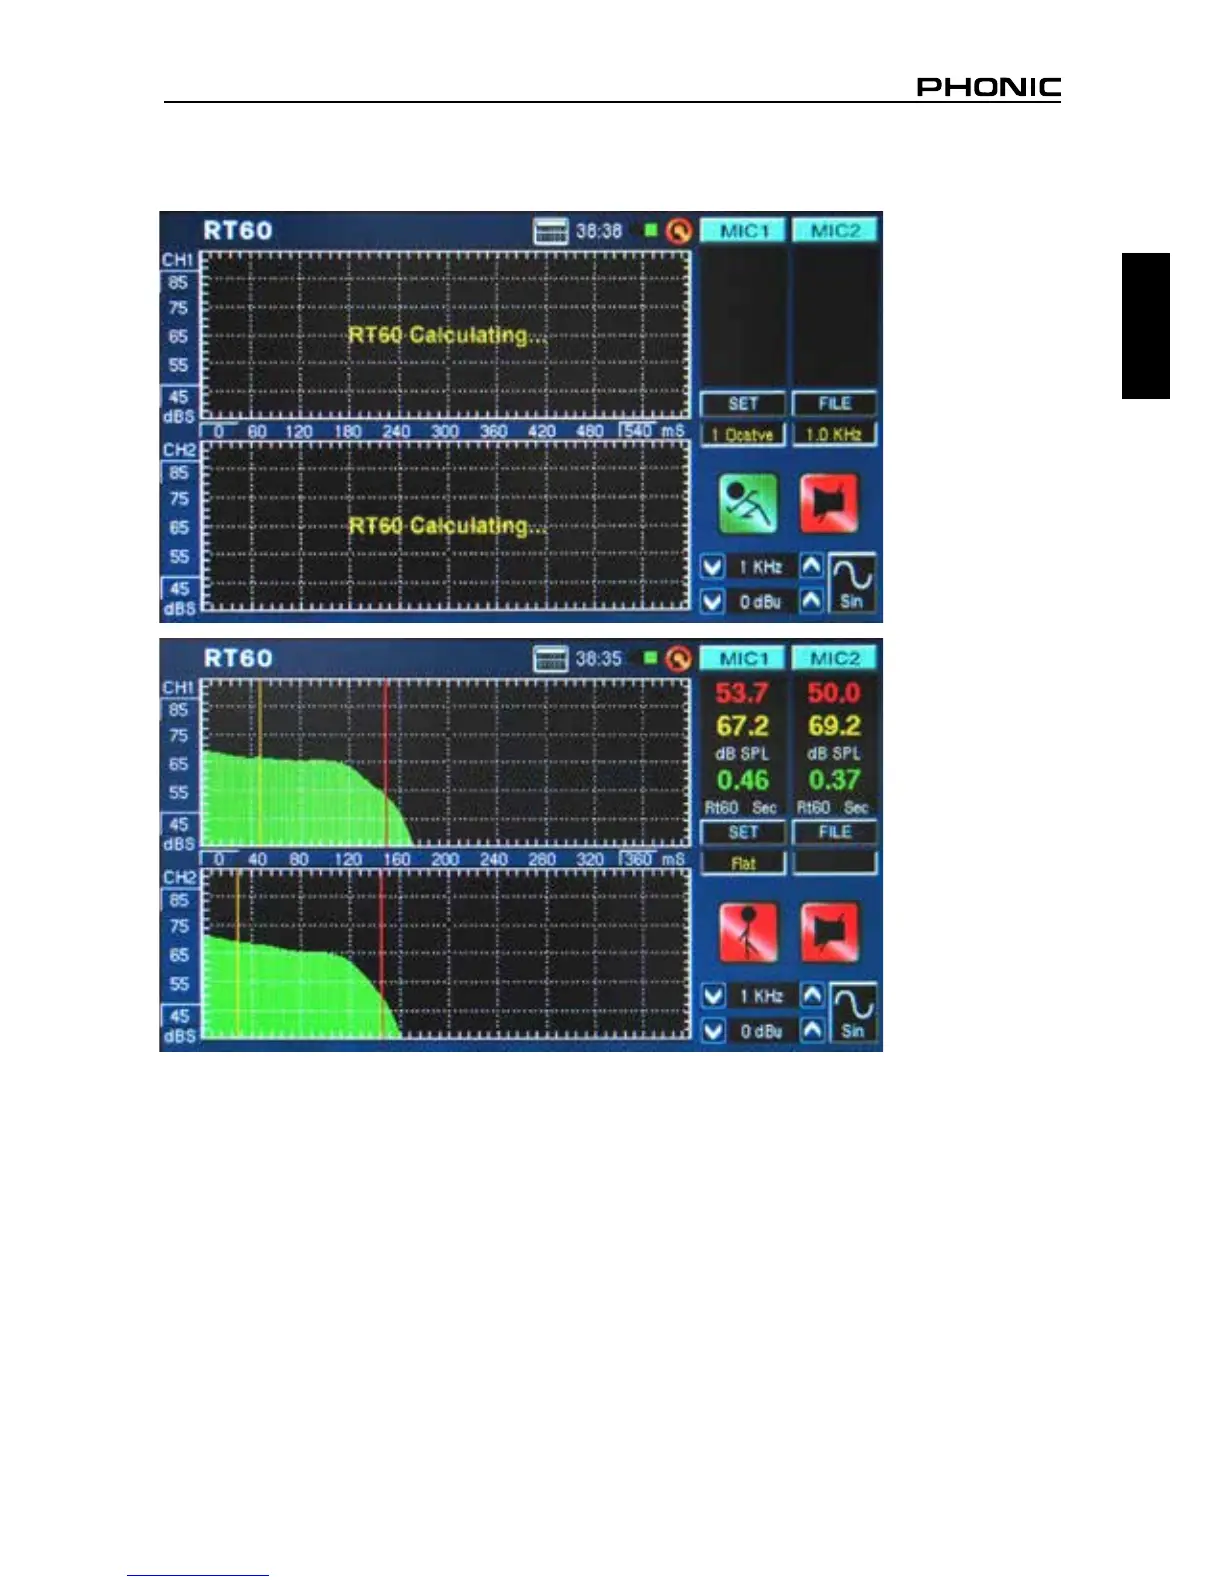
7. After the measurement is taken, the RT60 measurement graph will appear onscreen (gure 40,
and 41).
8. Moving the red and yellow vertical lines on the RT60 graph will allow you to rene your RT60 results.
Position one of these lines at the beginning of the decay slope and the other at the bottom to get an
accurate read-out of the RT60 time. These results can be found to the right of the RT60 graph.
figure 41
figure 40