PN 350-025004-09
Page | 13
The ATR Spectrum
ATR spectra are similar to transmission spectra. A careful comparison of ATR spectra and transmission
spectra reveals that the intensities of the spectral features in an ATR spectrum are of lower absorbance
than the corresponding features in a transmission spectrum and especially in the high wavenumber
(short wavelength) region of the spectrum. The intensity of the ATR spectrum is related to the
penetration depth of the evanescent wave into the sample. This depth is dependent upon the refractive
index of the crystal and the sample, and upon the wavelength of the IR radiation.
The relatively thin depth of penetration of the IR beam into the sample creates the main benefit of ATR
sampling. This is in contrast to traditional FTIR sampling by transmission where the sample must be
diluted with IR transparent salt, pressed into a pellet or pressed to a thin film, prior to analysis to
prevent totally absorbing IR bands.
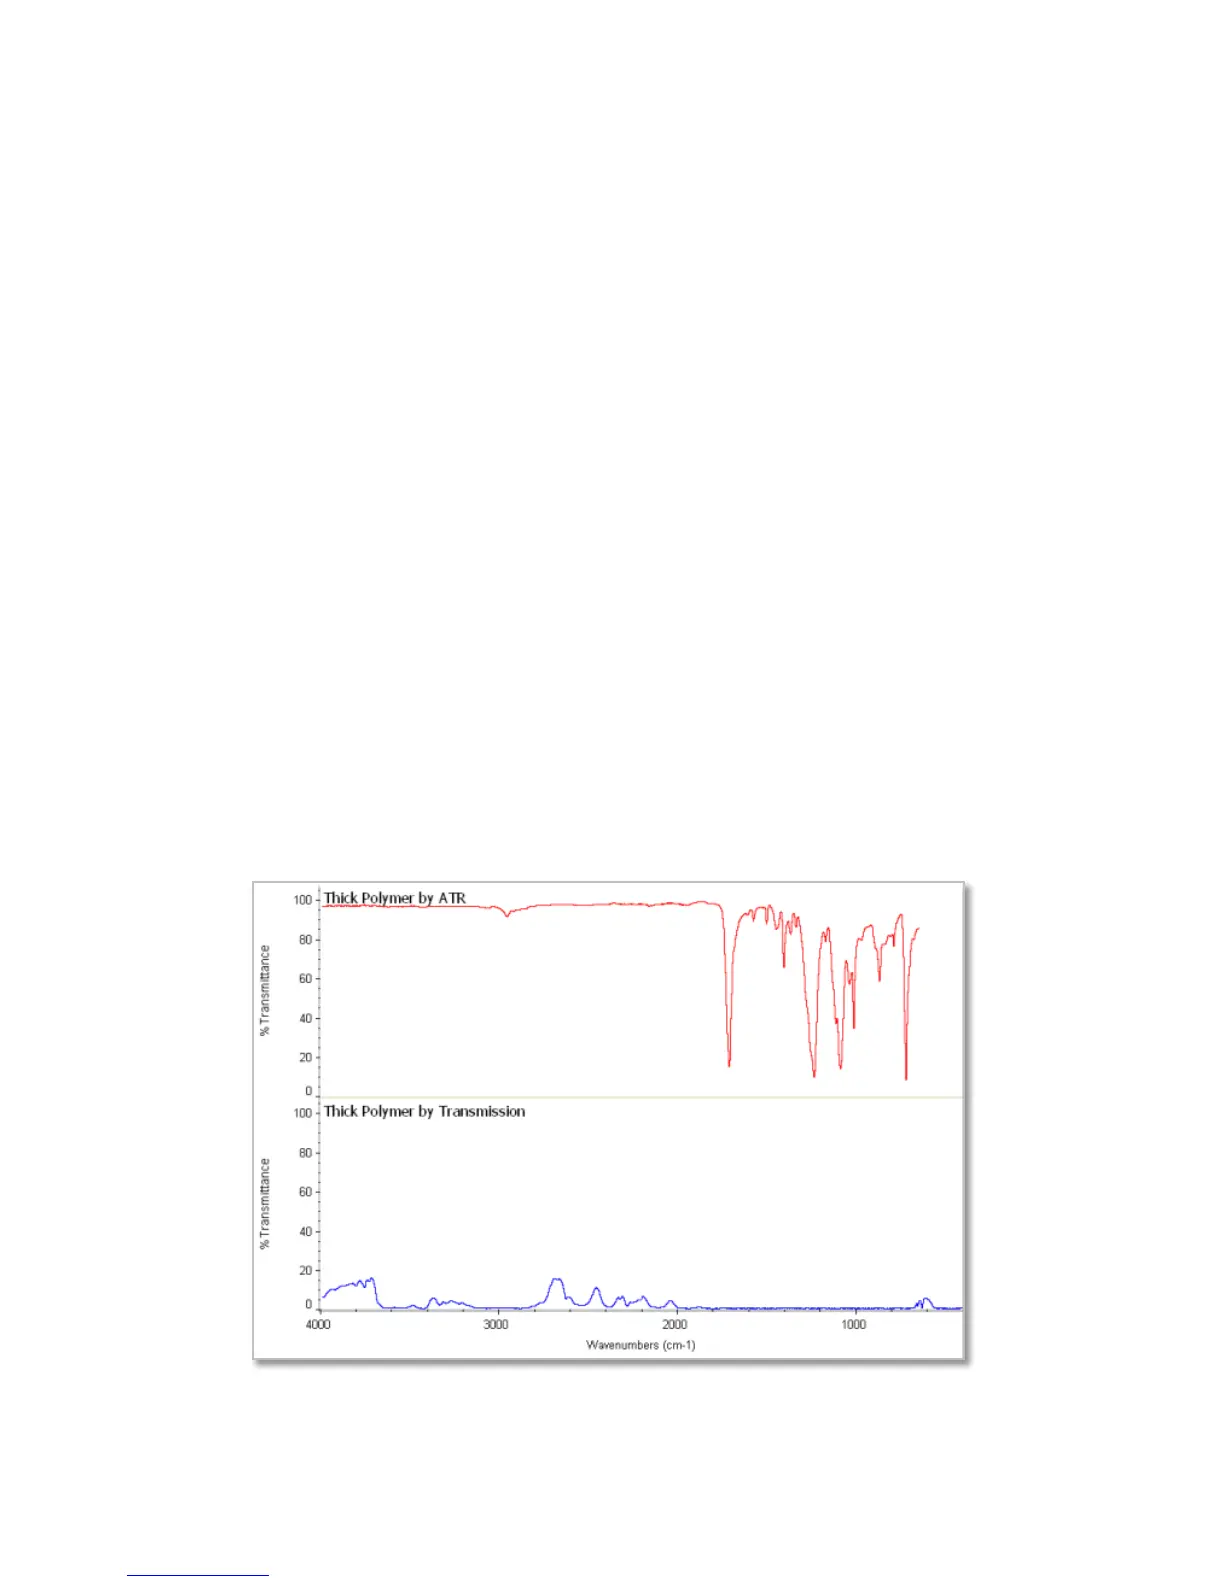
A comparison of transmission vs. ATR sampling result for a thick polymer sample is shown below where
the sample is too thick for high quality transmission analysis (lower blue spectrum). In transmission
spectroscopy, the IR beam passes through the sample and the effective path length is determined by the
thickness of the sample and its orientation to the directional plane of the IR beam. Clearly in this
example the sample is too thick for transmission analysis because most of the IR bands are totally
absorbing. However, simply placing the thick sample on the ATR crystal and applying pressure generates
a high quality spectral result (upper red spectrum) - identified by library search as a polybutylene
terephthalate. The total analysis time for the thick polymer by ATR was less than one minute.
Figure 7. Thick polymer sample FTIR spectrum collected by ATR and transmission
 Loading...