PN 350-025004-09
Page | 14
ATR Correction
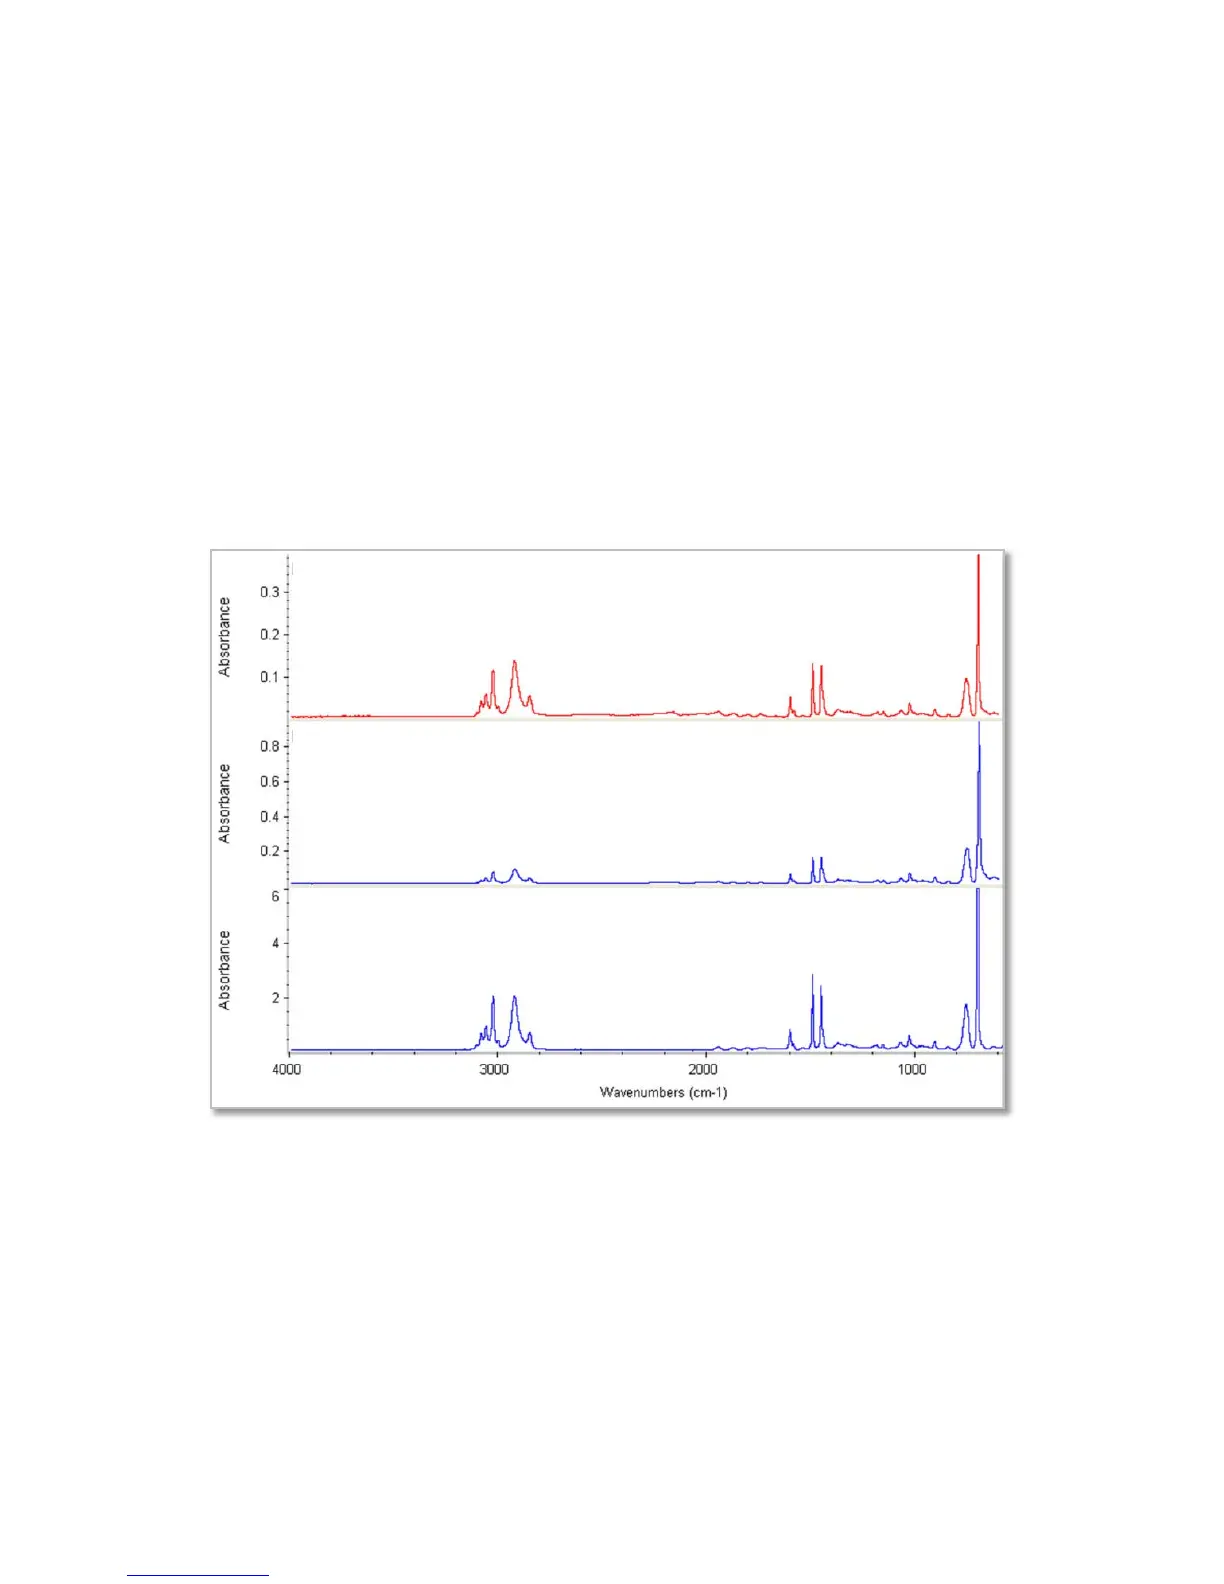
If an ATR spectrum representative of a transmission spectrum is desired, the ATR spectrum must be
processed with the ATR correction program available on your spectrometer software. An example of the
effect of this correction on a spectrum is shown in the following example for polystyrene. The middle
spectrum is the original ATR spectrum of polystyrene. The lower spectrum is the transmission spectrum
of polystyrene. Clearly the IR bands around 3000 cm
-1
in the ATR spectrum are weaker relative to the IR
bands at longer wavelength.
However, in the upper red spectrum after ATR correction, the relative IR band intensities are very similar
to those from the polystyrene run by transmission.
Figure 8. ATR corrected polystyrene spectrum
Polystyrene, ATR Corrected
Polystyrene, ATR, Original Spectrum
Polystyrene, 1.5 mil. film, by transmission
 Loading...