0DNLQ J0HDVXUHPHQWV
To set the tracking filter, the range diagram in figure 4.1 can be summarized
with the following rules of thumb:
Below a particular velocity, no dynamic limits have to be taken into consid-
eration. Thus in the lower measurement ranges (1 and 5 ) the
setting SLOW can generally be selected.
For medium velocities and frequencies, the acceleration limits of the
tracking filter have to be taken into consideration. The optimal setting
must be found with the range diagram. If the velocity or acceleration limits
are exceeded, the tracking filter loses lock (refer to section D.2). This will
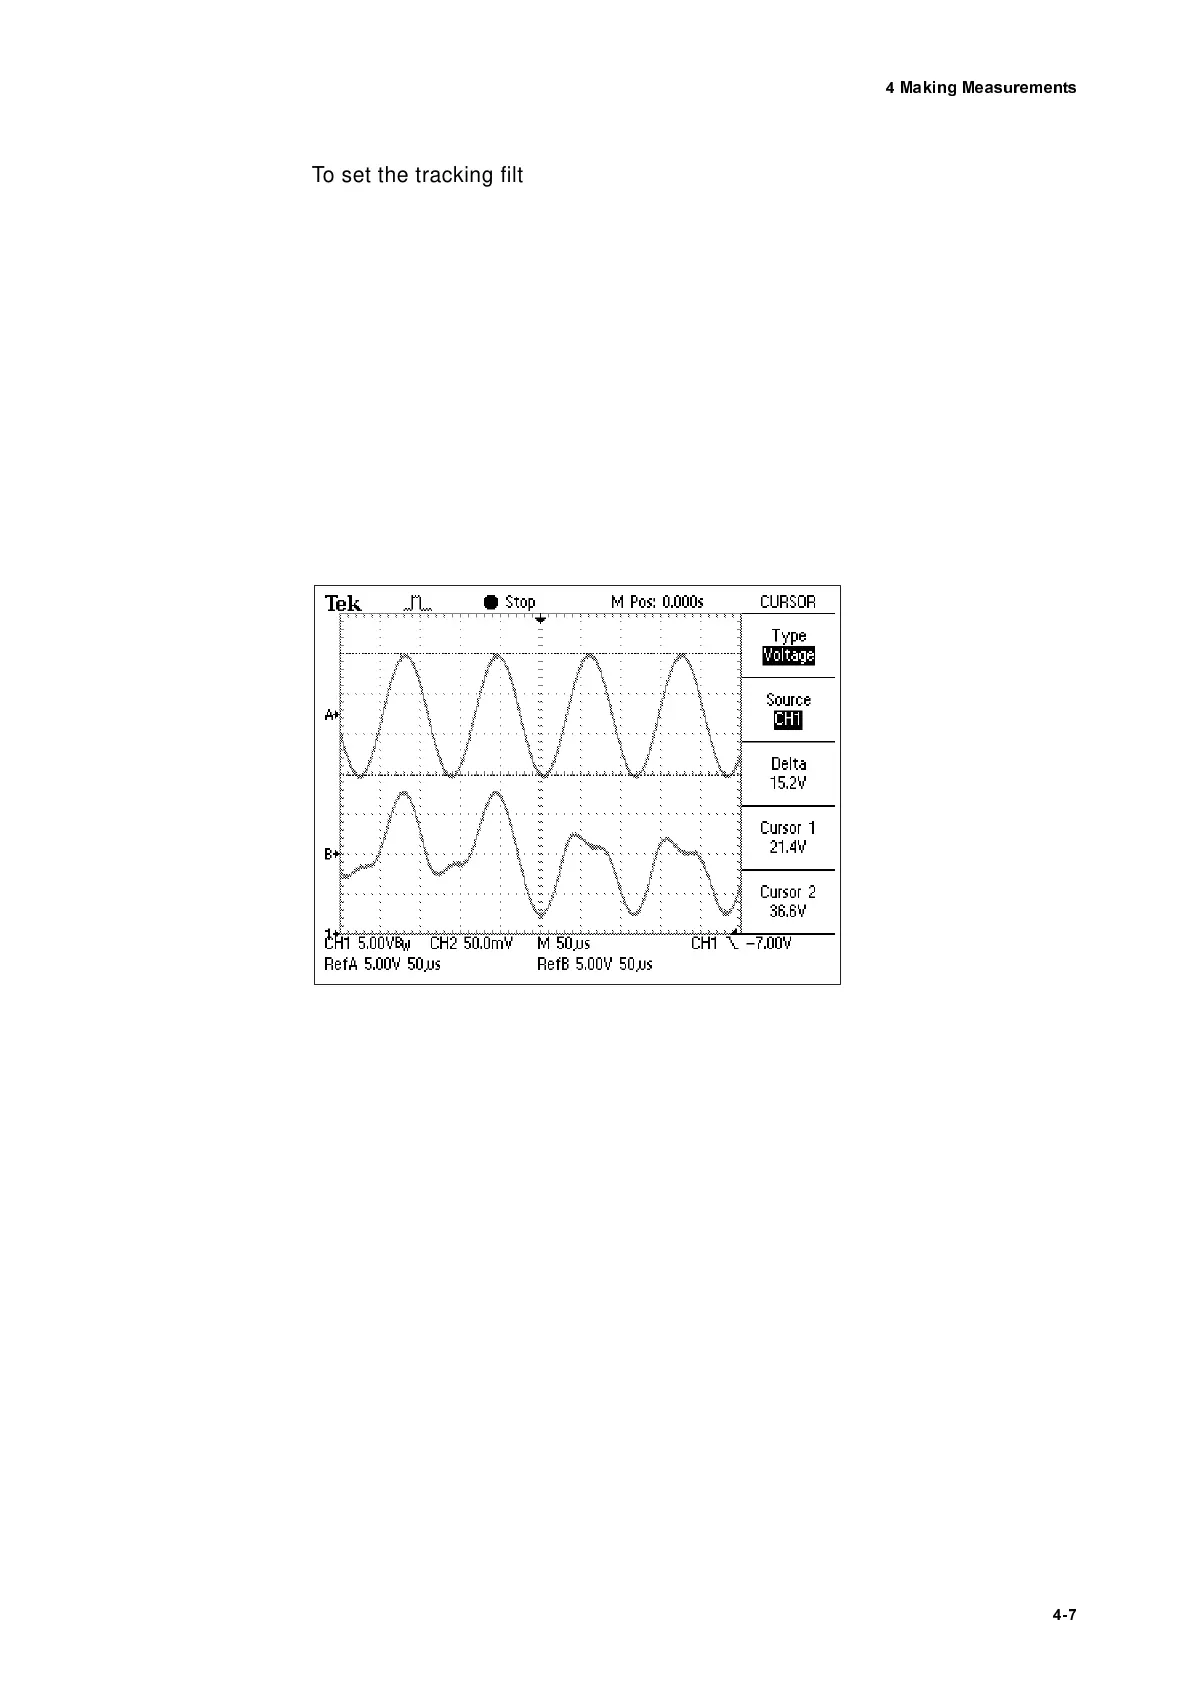
cause serious signal distortions an example of which can be seen on the
oscilloscope trace in figure 4.2. The signal A shows a sinusoidal velocity
signal with the tracking filter in position OFF. Signal B shows the signal
with the tracking filter in position SLOW. The tracking filter is on the limit of
the range where it loses lock, the signal is partly distorted.
For frequencies above 100kHz as a general rule the tracking filter should
be switched off. In principle it can follow higher frequencies but in this
range amplitude errors of up to approximately 10% can occur due to
dynamic errors.
With good optical signals, the tracking filter can not improve the signal-to-
noise ratio due to physical reasons. It should be switched off if unfavorable
effects are observed.
Figure 4.2: True velocity signal (A) and signal when the tracking filter loses lock (B)
mm
s
----------
V
mm
s
----------
V