English
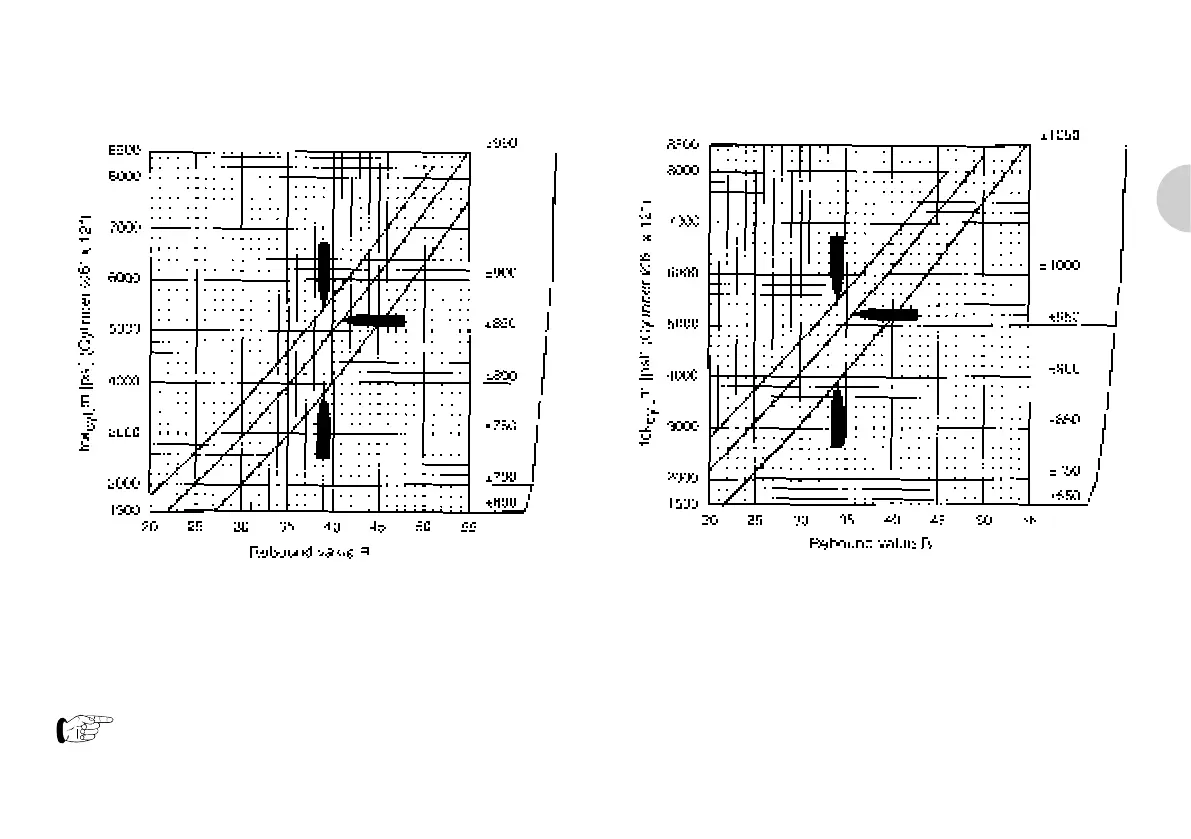
Conversion Curves, Concrete Test Hammer Model L/LR
Concrete pressure resistance of a cylinder after 14 - 56 days
Dispersion [psi]
Fig. 2.10 Model L/LR: Conversion curves based on the
average compressive strength of a cylinder
and the rebound value R
Limits of Dispersion
fck
cube
: The max. and min. values are set so 80% of
all test results are included.
© 2017 Proceq SA Measurement 9
Conversion Curves, Concrete Test Hammer Model N/NR
Concrete pressure resistance of a cylinder after 14 - 56 days
Dispersion [psi]
Fig. 2.9 Model N/NR: Conversion curves based on
the average compressive strength of a cylinder
and the rebound value R
fck
cyl.
m: Average pressure resistance of a cylinder
(probable value)
The concrete test hammers shown in Fig. 2.9
and Fig. 2.10 indicate the impact direction.