28
QSC Audio Products, LLC
5. Adjust the mode switch to “DEEP”. Verify a slight increase in output voltage on the LF channel.
6. On K8/K10/K12 models, adjust the mode switch to “EXT SUB”. Verify a decrease in output voltage on the LF channel.
7. Apply a 500 mVrms, 6 kHz sine wave signal. Using a DMM, verify the measurements in the table below.
Model Ch1+/Ch1- Vrms @ 6 kHz Ch2+/Ch2- Vrms @ 6 kHz
KSub 0 V 0 V
K8 0 V 13—17 V
K10 0 V 13—17 V
K12 0 V 13—17 V
8. On K8/K10/K12 models, adjust the mode switch to “VOCAL BOOST”. Verify a increase in output
voltage on the HF channel.
9. On K8/K10/K12 models, apply a 100 mVrms, 6 kHz sine wave signal to channel A now. Turn the
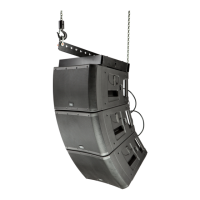
gain knob on the left side to the 12 o’clock or 0 dB position. Adjust the mode switch from “LINE”
to “MIC”. Verify a large increase in output voltage on the HF channel.
Note: KSub BOPs should only pass frequencies 100 Hz and below from both channels. K8/K10/K12 BOPs should pass
frequencies below 2 kHz on channel 1 and pass frequencies above 2 kHz on channel 2.
Step 4: Full power test
In order to test full power it is highly recommended to purchase a test adapter from Technical Services Group (QSC part #
SG-000576-TS). Without the test adapter it will be very difficult to connect an 8 ohm load to the molex connector.
Warning: Do not perform full power tests with load for more than 10 seconds. It may cause internal damage to the
BOP and/or blow AC fuse F1.
1. Place the BOP in test mode by following the instructions in “Activating “test mode”” on page
26.
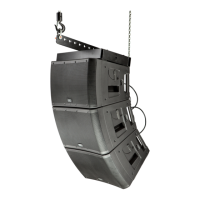
2. Using a audio sine-wave generator, connect a balanced XLR or 1/4” TRS cable to channel
B’s input only. Turn the gain knob on the right side to the 12 o’clock or 0 dB position.
3. Connect the test-adapter to the back of the molex jack. Adjust the adapter’s switch to
“bypass”. Disconnect any loads from the adapter. We will perform an open-circuit, unloaded
test on both channels first.
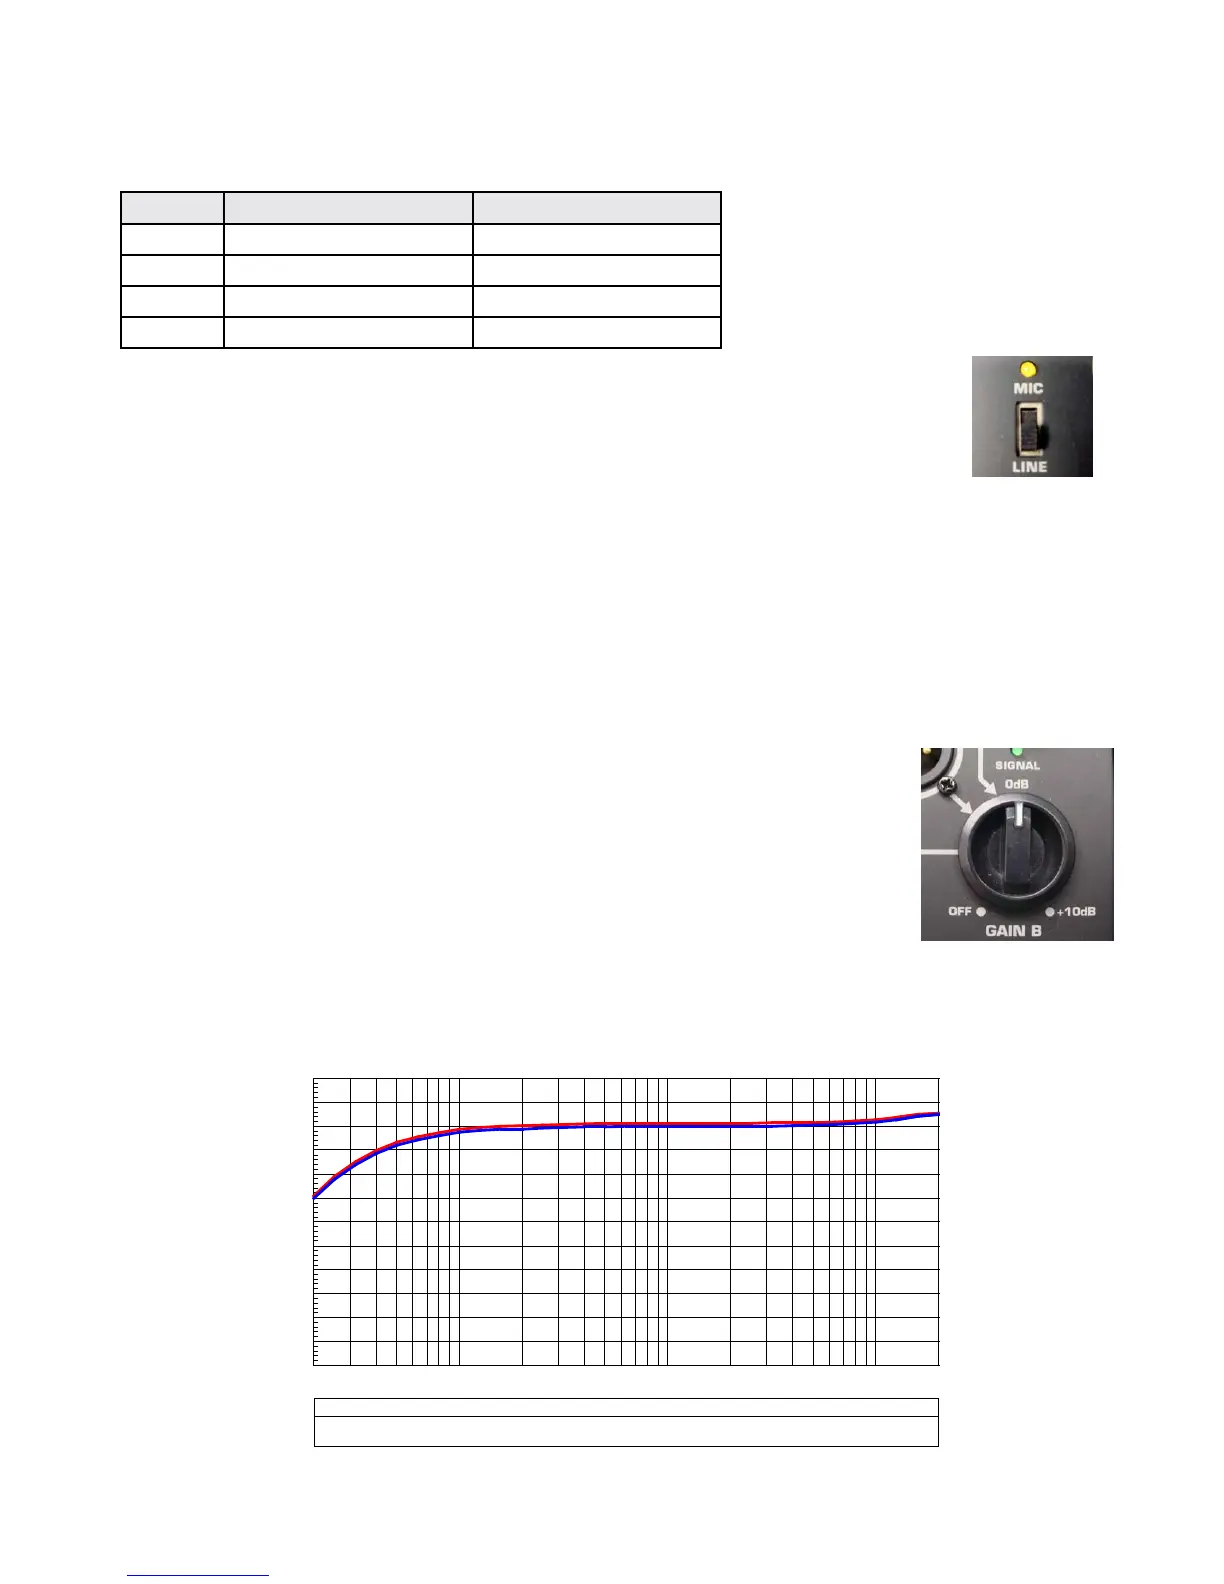
4. For KSub BOPs, apply a 2.35 mVrms sine wave signal. For K8/K10/K12 BOPs, apply a 1.75
mVrms sine wave signal. Adjust the frequency while taking individual output voltage mea-
surements for each frequency. Verify channel 1 and channel 2 have similar output voltages compared with the graph
below, +/- 5V.
Bucket of Power "Test Mode" - Unloaded Output Voltage
ColorSweep Trace Line Style Thick Data Axis Comment
1 1 Red Solid 1 Anlr.Level A Left Channel 1
1 2 Blue Solid 1 Anlr.Level B Left Channel 2
0
60
5
10
15
20
25
30
35
40
45
50
55
V
20 20k50 100 200 500 1k 2k 5k 10k
Hz
Figure 8.6 - Unloaded output voltage (both channels) vs frequency
 Loading...