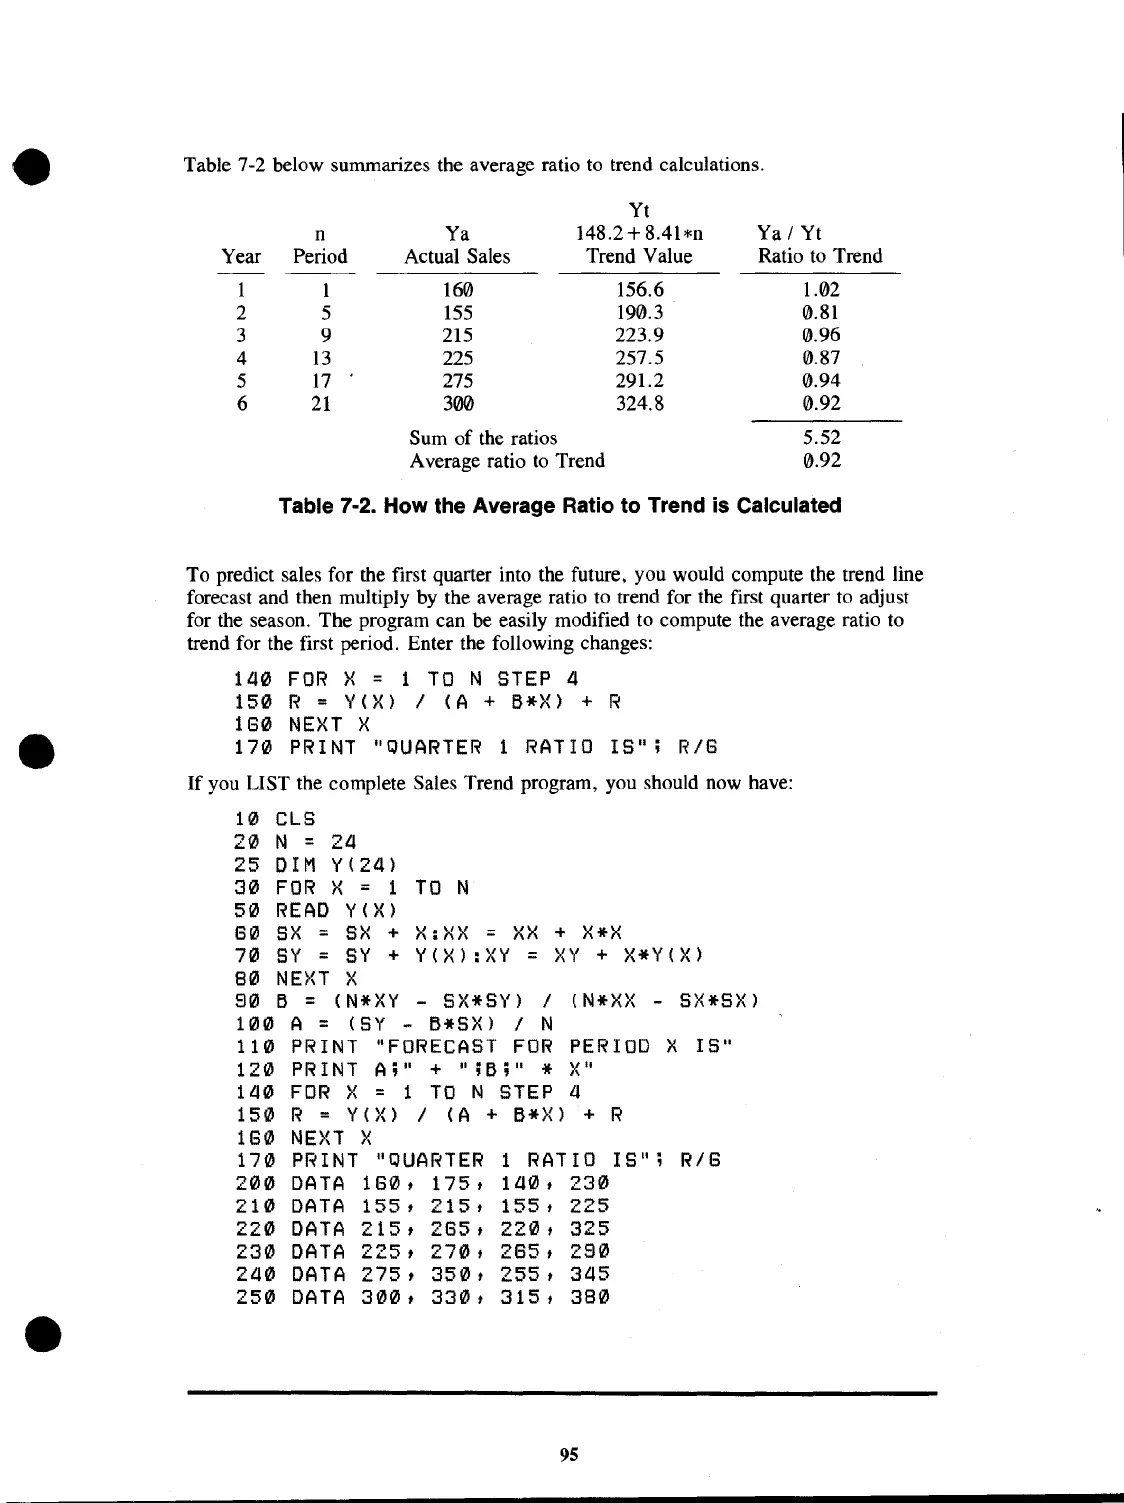
Table 7-2 below summarizes the average ratio to trend calculations.
Yt
n
Ya
148.2+
8.41*n
Ya
/
Yt
Year
Period Actual Sales Trend Value
Ratio to Trend
1
1
160 156.6 1.02
2
5
155
190.3 0.81
3
9
215
223.9
0.96
4
13
225
257.5
0.87
5
17
275
291.2
0.94
6
21
300
324.8
0.92
Sum
of
the ratios
5.52
Average ratio
to
Trend
0.92
Table 7-2. How the Average Ratio to Trend is Calculated
To predict sales for the first quarter into the future, you would compute the trend line
forecast and then multiply by the average ratio to trend for the first quarter to adjust
for the season.
The
program can be easily modified to compute the average ratio to
trend for the first period. Enter the following changes:
140
FOR
X = 1
TO
N STEP 4
150
R =
Y(X)
I (A +
6*X)
+ R
160
NEXT
X
170
PRINT "QUARTER 1 RATIO
IS";
R/6
If
you LIST the complete Sales Trend program, you should now have:
10
CLS
20
N =
24
25
DIM
Y(24)
30
FOR
X = 1
TO
N
50
READ
Y(X)
60
SX
=
SX
+ X:XX =
XX
+
X*X
70
SY
=
SY
+
Y(X):XY
=
XY
+
X*Y(X)
80
NEXT
X
80
6 = (N*XY - SX*SY) I (N*XX - SX*SX)
100
A = (SY -
6*SX)
I N
110
PRINT "FORECAST
FOR
PERIOD X
IS"
120
PRINT
A;"
+
";6;"
*
X"
14111
FOR
X = 1
TO
N STEP a
150
R =
Y(X)
I
(A
+
6*X)
+ R
160
NE}{T
X
170
PRINT "QUARTER 1 RATIO
IS";
R/6
200
DATA
160,
175,
140,
230
210
DATA
155,
215,
155,
225
220
DATA
215,
265, 220,
325
230
DATA
225,
270,
265,
280
240
DATA
275,
350,
255,
345
250
DATA
300,
330,
315,
380
95
 Loading...