Experiment
#4
Axis Scale
You can add
"tick"
marks
to
your axes
to
indicate a relative scale. Clear the display
and list your program to confirm that it
is:
50
CLS
100
LINE(238,54)-(33,54)
150
LINE
-(33t0)
Enter the following new lines to your program:
200
FOR
X=33
TO
300
PSET
(X,53)
500
FOR
Y-51
TO
600
PSET
(34,Y)
238
STEP
24
NEXT
X
o STEP
-8
:
NEXT
Y
List the entire program to confirm that it
is
now:
50
10.O
150
200
300
500
600
CLS
LINE
(238,54)
LINE
-(33,O)
FOR
X -
33
TO
PSET
(X,53)
:
FOR
Y = 51
TO
PSET
(34,Y)
:
238
STEP
24
NEXT
X
o STEP
-8
NEXT
Y
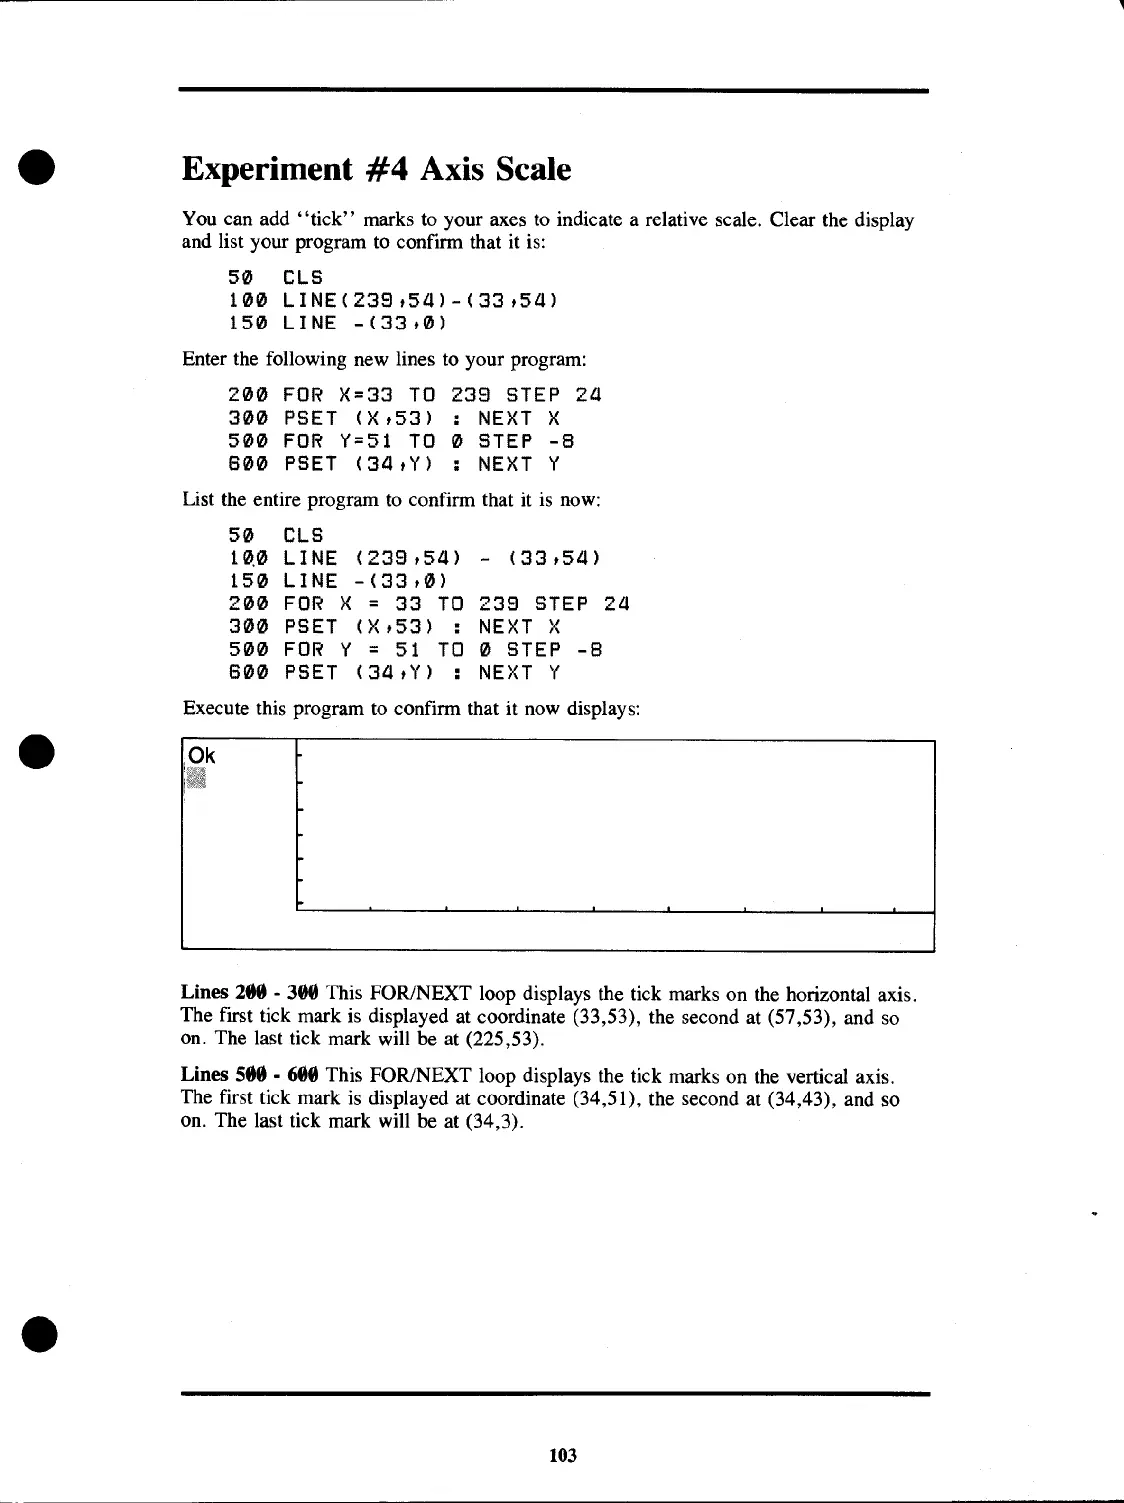
Execute this program to confirm that it now displays:
Lines
28t)
·388
This FOR/NEXT loop displays the tick marks on the horizontal axis.
The first tick mark is displayed at coordinate (33,53), the second at (57,53), and
so
On.
The last tick mark will be at (225,53).
Lines
S8t)
. 689 This FOR/NEXT loop displays the tick marks on
the
vertical axis.
The first tick mark
is
displayed at coordinate (34,51), the second at (34,43), and so
On.
The last tick mark will be at (34,3).
103
 Loading...