Experiment
#5
Label the Axes
It
is usually a good idea to label the scale of your graph. This experiment will show
you how
to
print both the horizontal and vertical labels. Add the following lines to
your program:
700
FOR
X=0
TO
28
STEP 4
710
PRINT@
284+X,
X;
NEXT
X
720
FOR
Y=l
TO
7
730
PRINT@
280-Y*40,
100+Y*50
740
NEXT
Y
2000
GOTO
2000
List the program to confirm that it
is
now:
50
CLS
100
LINE
(238,54)
-
(33,54)
150
LINE
-(33,0)
200
FOR
X =
33
TO
238
STEP
24
300
PSET
(X,53)
:
NEXT
X
500
FOR
Y = 51
TO
0 STEP
-8
800
PSET
(34,
Y)
:
NEXT
Y
700
FOR
X=0
TO
28
STEP 4
710
PRINT@
Z84+X,
X;
NEXT
X
720
FOR
Y=l
TO
7
730
PRINT@
280-Y*40,
100+Y*50
740
NEXT
Y
2000
GOTO
2000
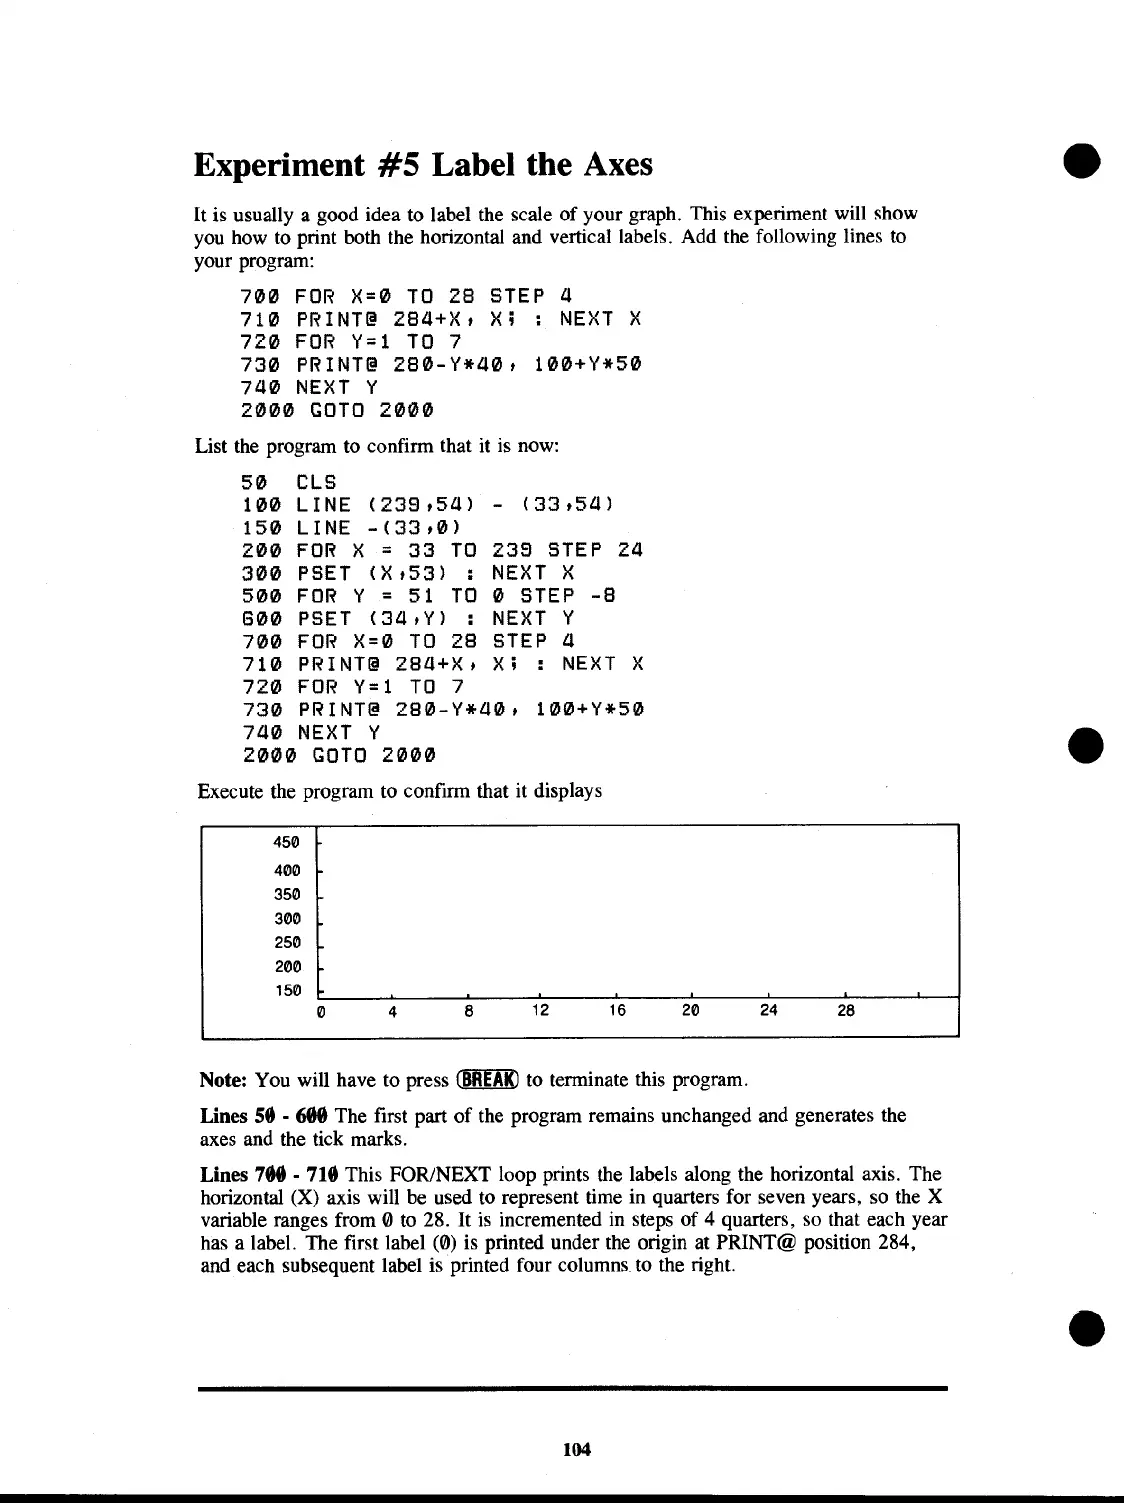
Execute the program to confirm that it displays
450
400
350
300
250
200
150
o
4
8
12
16
20 24
28
Note: You will have to press
~
to terminate this program.
Lines
58
- 688 The first part
of
the program remains unchanged and generates the
axes and the tick marks.
Lines
788 . 718 This FOR/NEXT loop prints the labels along the horizontal axis. The
horizontal (X) axis will be used to represent time in quarters for seven years, so the X
variable ranges from
0 to 28.
It
is
incremented in steps of 4 quarters, so that each year
has a label. The first label (0) is printed under the origin at PRINT@ position 284,
and each subsequent label is printed four columns to the right.
104
 Loading...