*
* ****
* ****
* ****
*
****
* ****
* ****
* ********
* ********
* ********
* ************
*
************
* ************
* ************
* ************
* ************
* ************
* ************
* ************
* **************** ****
* **************** ****
*
****************
****
* ************************************
* ************************************
* ************************************
* ****************************************
* ****************************************
* ****************************************
*
****************************************
* ****************************************
**************************************************************************
1 2 3 4 5 6 7 8 9
10
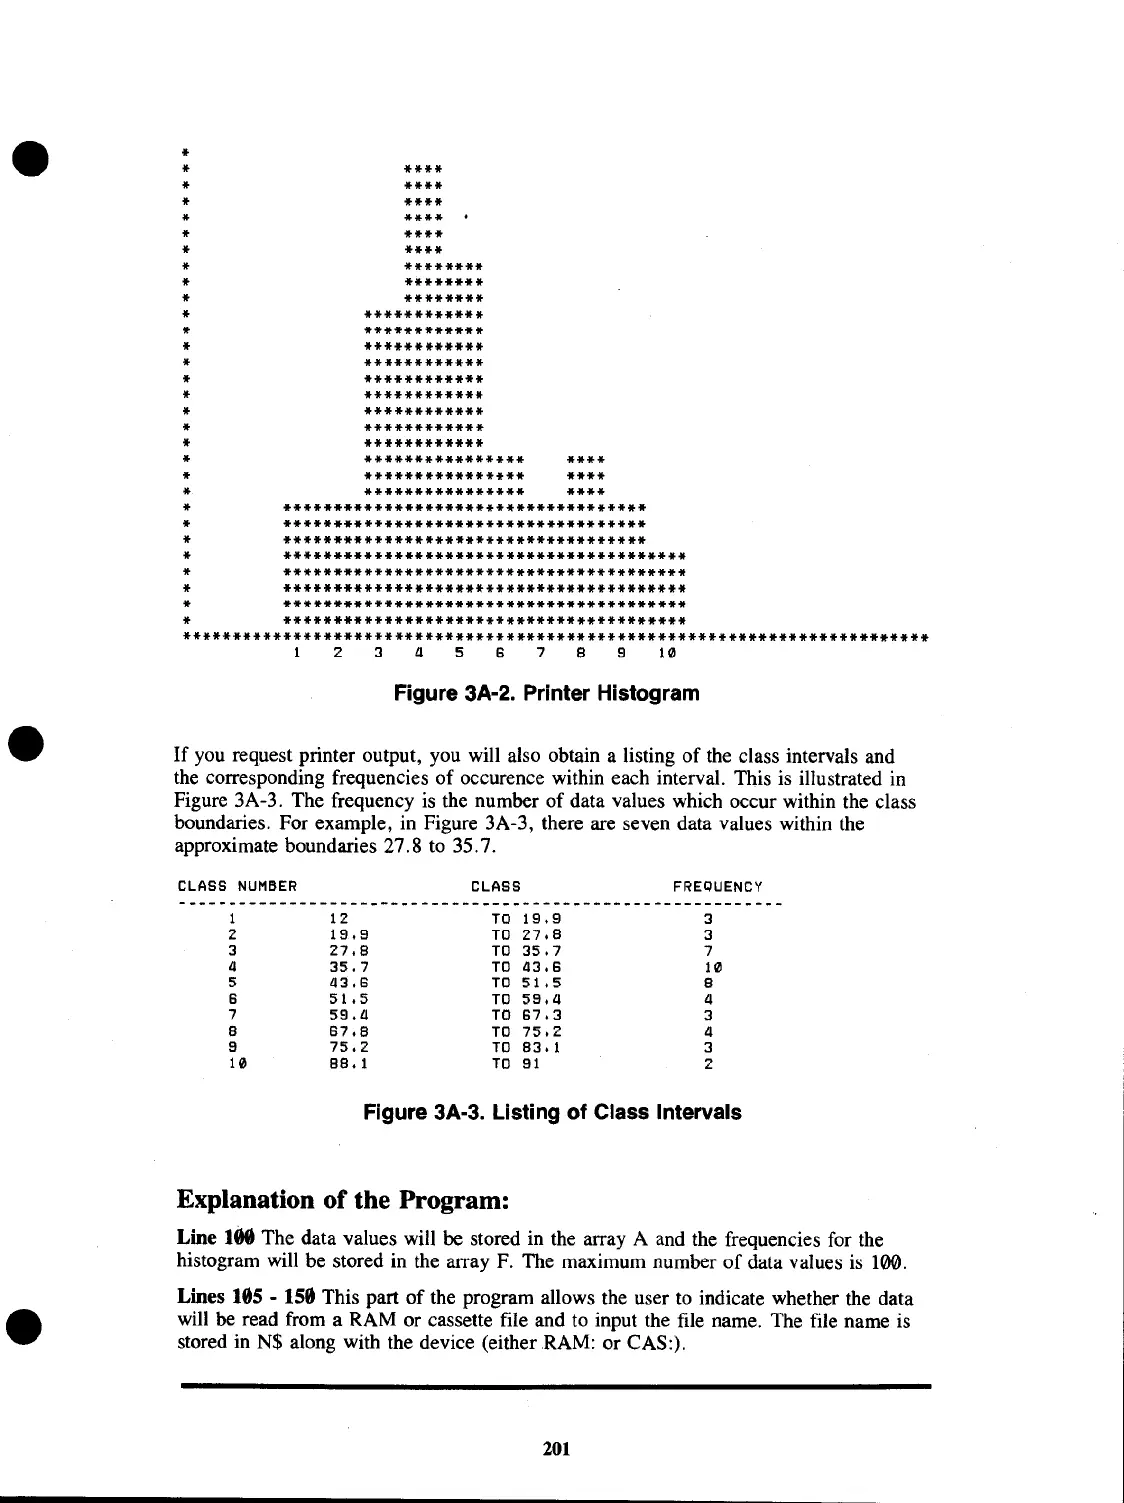
Figure 3A-2. Printer Histogram
If
you request printer output, you will also obtain a listing of the class intervals and
the corresponding frequencies of occurence within each interval. This is illustrated in
Figure 3A-3. The frequency
is
the number of data values which occur within the class
boundaries. For example, in Figure 3A-3, there are seven data values within the
approximate boundaries 27.8 to 35.7.
CLASS
NUMBER
1
2
3
4
5
6
7
8
9
10
12
18.8
27.8
35.7
43.6
51.5
59.4
67.8
75.2
88.1
CLASS
TO
19.9
TO
27.8
TO
35.7
TO
43.6
TO
51.5
TO
58.4
TO
67.3
TO
75.2
TO
83.1
TO
81
FREQUENCY
3
3
7
10
8
4
3
4
3
2
Figure 3A-3. Listing of Class Intervals
Explanation
of
the Program:
Line 188 The data values will
be
stored in the array A and the frequencies for the
histogram will be stored in the array
F.
The maximum number
of
data values
is
100.
Lines 195 - 159 This part of the program allows the user to indicate whether the data
will be read from a RAM or cassette file and to input the file name. The file name is
stored in N$ along with the device (either RAM: or CAS:).
201
 Loading...