RIGOL
RSA3000 Quick Guide 11
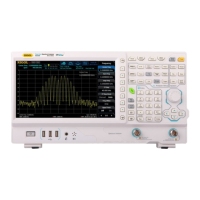
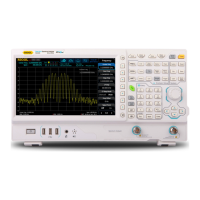
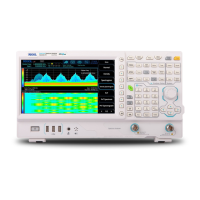
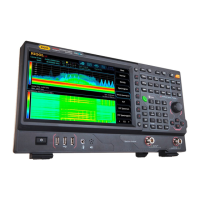
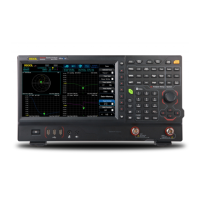
Spectrum line
display area
Indicates the display area for the spectrum
line.
Indicates the resolution bandwidth.
Center or start
frequency
The frequency range of the current sweep
channel can be expressed by the combination
of center frequency and span or the
combination of start frequency and stop
Indicates the scale indication in the Y axis.
Note
[1]
: For the user interface of the EMI mode, refer to
EMI User's Guide.
Note
[2]
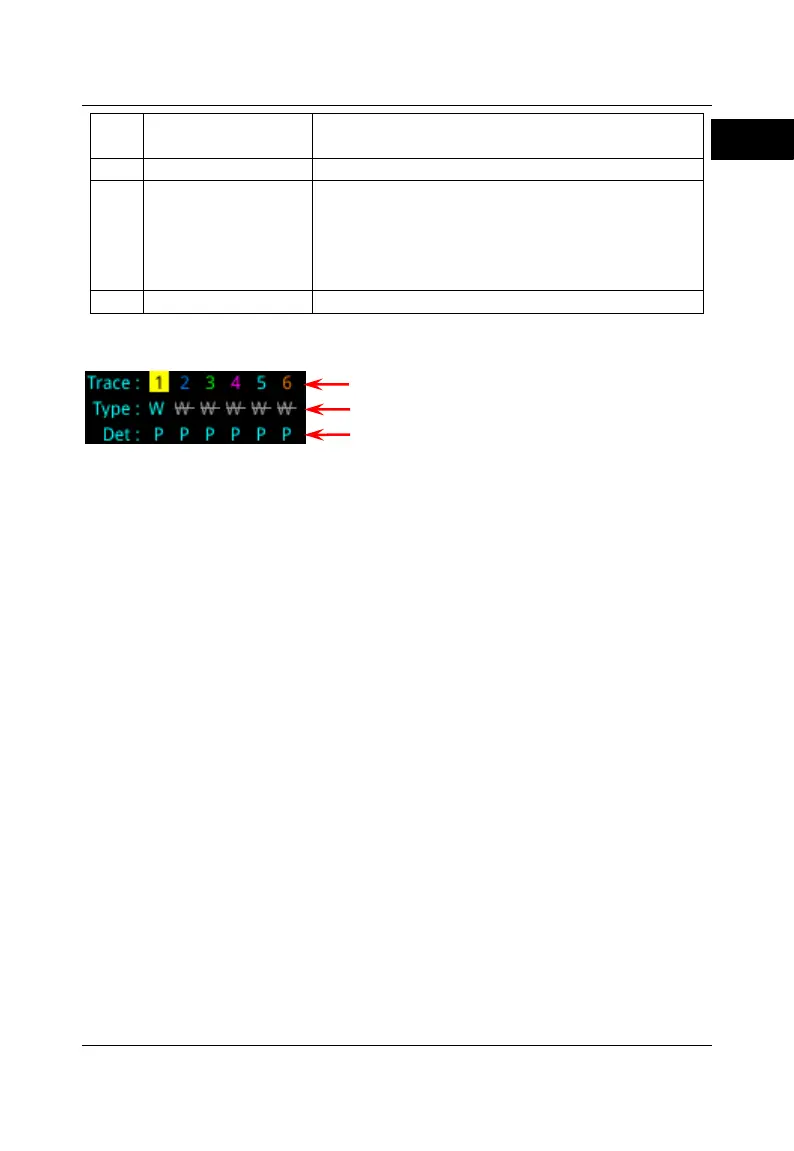
: The display of the trace indicator is shown in the following figure:
The first line displays the trace number. The color of the number is the same as that of
the trace.
The second line displays the trace type, including W (Clear/Write), A (Average), M
(Maximum Hold), and m (Minimum Hold). The letters with different colors and in
different forms show different meanings.
— The letter in blue indicates that the trace is updating.
— The letter in gray indicates that the trace is not updated.
— The letter with strikethrough and in gray color indicates that the trace will neither
be updated nor displayed.
— The letter with strikethrough and in blue color indicates that the trace is updating
but not displayed. It is useful in trace math operation.
The third line displays the detector type of each trace, including N (Normal, only for
GPSA), V (Voltage Average, only for GPSA), P (Positive Peak), p (Negative Peak), S
(Sample), R (RMS Average, only for GPSA), Q (Quasi Peak, option, only for GPSA) and A
(Average, only for RTSA). If it shows "f", it indicates that it is math operation trace. The
letter in blue in the third line (detector type) indicates that the detector is in auto state;
the letter in white indicates that it is in manual state.
 Loading...