C
C
H
H
A
A
P
P
T
T
E
E
R
R
:
:
S
S
C
C
A
A
L
L
E
E
D
D
o
o
c
c
.
.
N
N
a
a
m
m
e
e
:
:
U
U
s
s
e
e
r
r
M
M
a
a
n
n
u
u
a
a
l
l
4.6 History
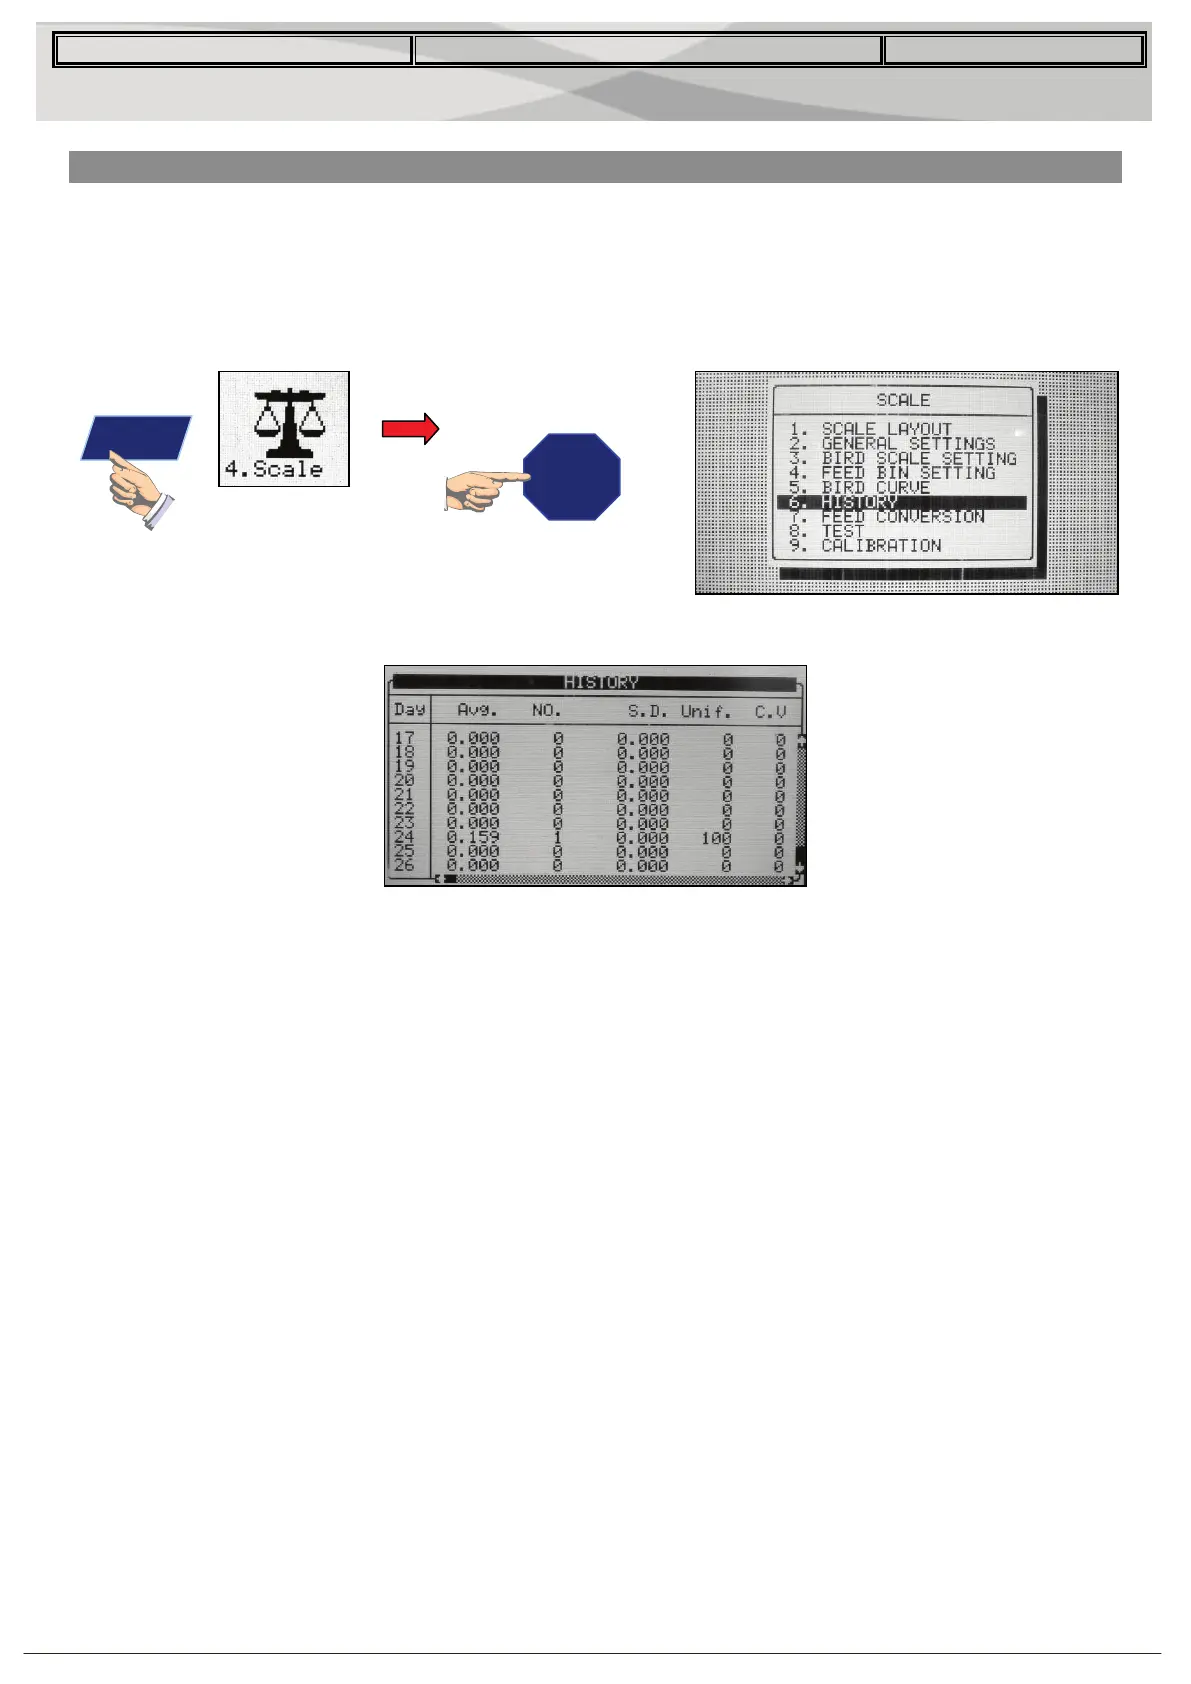
The scale history shows bird weight statistics. You can review daily data for each scale, or
separately. Up to two bird scale data are recorded; if you have more than one scale-1 or
one scale-2, their data is combined.
• If you selected SEXED weighing, the history includes Average data for the combined
scales, and on the next screens separate data for each scale.
• If you select MIXED weighing, the history includes Average data for all birds, and
separate male and female data for scale 1 and also for scale 2.
• Use the arrow keys to scroll to the separated scale data, or up and down for data that is
off screen.
• The average and the number of weights are the usual definition. The Standard
Deviation is the usual biased estimator (see a suitable textbook on statistical
measurements). The Uniformity is the industry standard 10% uniformity (number of
birds per 100 within 10% of the average weight), and the Coefficient of Variation or C.V.
is the normalized standard deviation (standard deviation divided by average times
100 %.)
Enter



 To Next Page