- 32 -
8. Diagnosis of abnormal cooling circuit
(1) Normal mode
㽲㩷 Frequency: Diagnosis is performed for once per day (2:00a.m. or later) on either compressor A and B.
Diagnosis of compressor A is done first.
(Ex.) After the power is supplied, diagnosis of compressor A is performed at 2:00a.m. or later.
Diagnosis of compressor B is performed the next day.
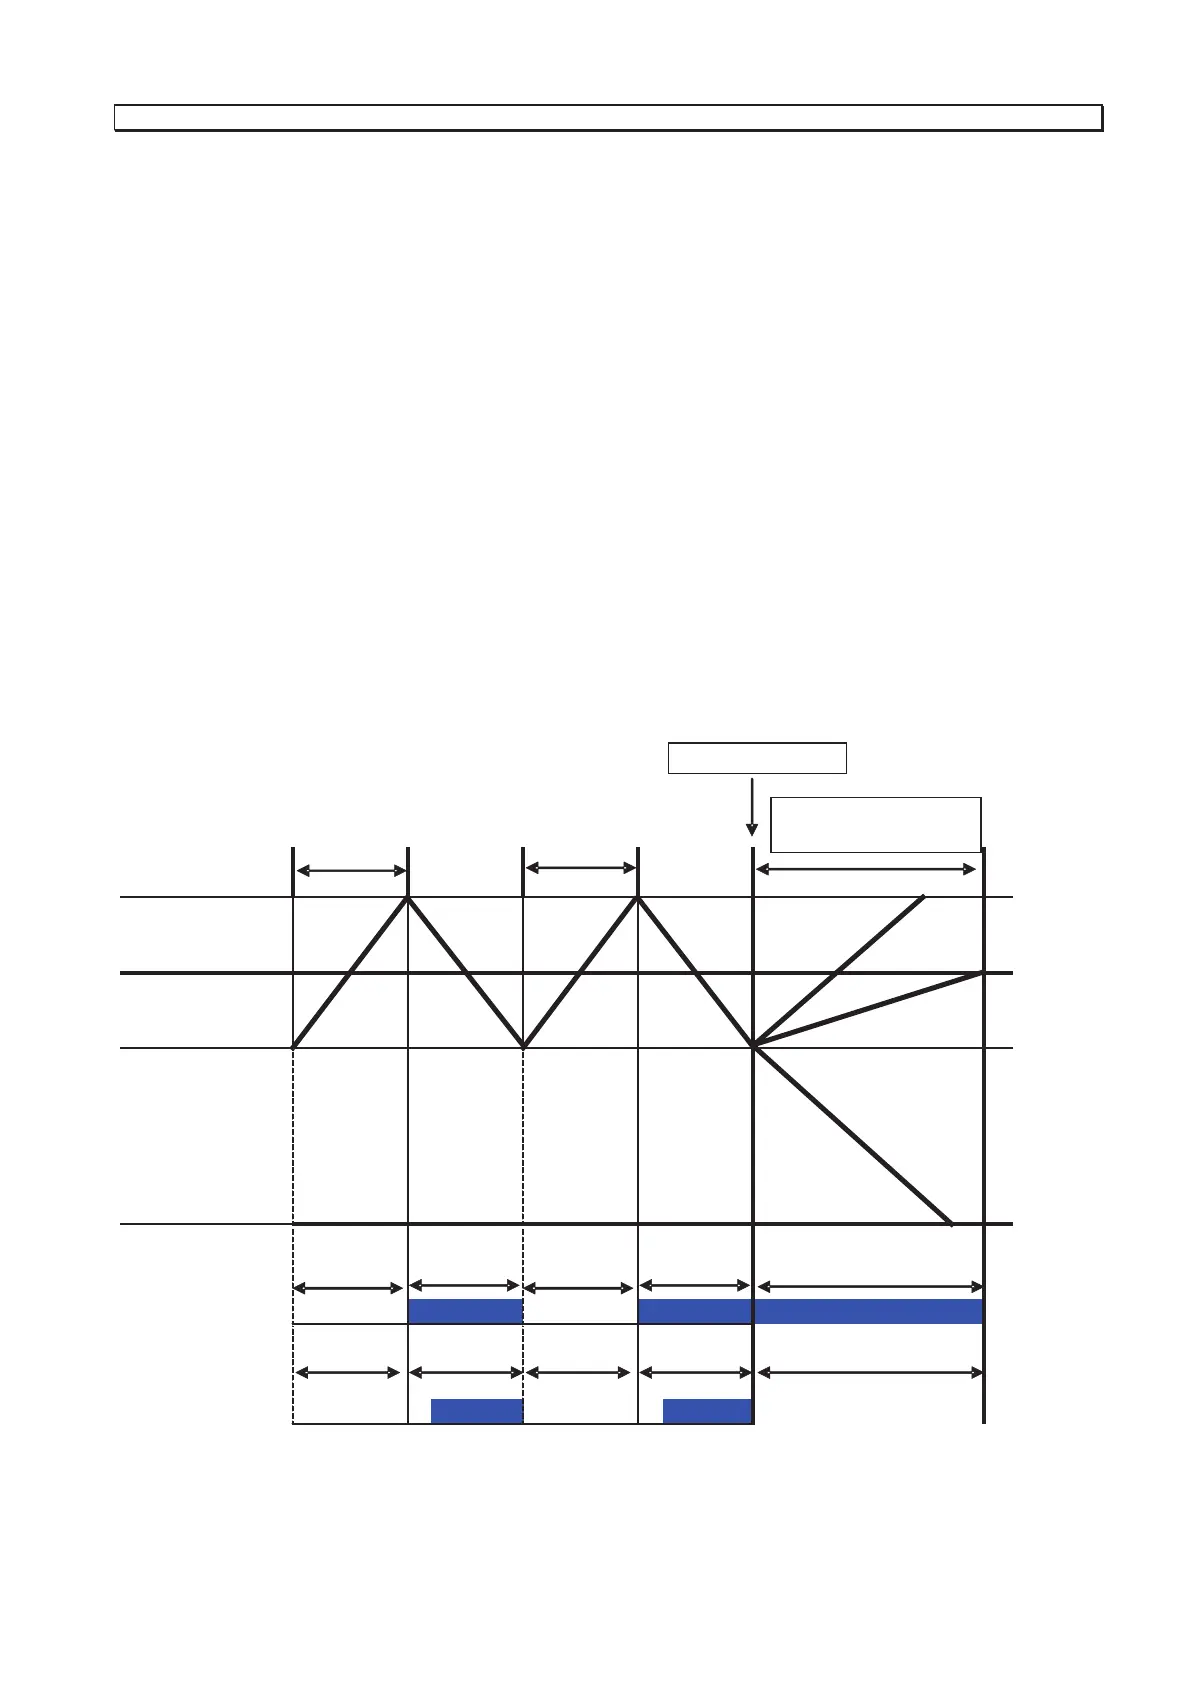
㽳㩷 2 portions of pull-up time just before diagnosis (㽳 indicated in the picture below) are stored.
㽴 Calculation of period for diagnosing cooling circuit: (ǻT1+ǻT2)/2x1.1 (Ԛ indicated in the picture below)
Diagnosis pattern
a. When unit reaches set temp -2.0㷄 beyond the OFF point (set temp -0.6㷄) during a single compressor
cycle, the diagnosis is considered 㵰Normal㵱 that the unit can keep cooling performance.
(Line-a indicates in the picture below)
b. When unit keeps temperature almost near set temp and diagnosis period expires, the diagnosis is
considered 㵰Normal㵱 that the unit can keep cooling performance.
(Line-b indicates in the picture below)
c. When unit reaches the ON point (set temp +0.6㷄) during diagnosis, the diagnosis is considered
㵰Abnormal㵱 that the unit cannot keep cooling performance because temperature increases is the same
as pull-up temperature except in cycle operation. (Line-c indicates in the picture below)
ĺ Diagnosis will be performed again 48 hours later and it will be determaind as a 㵬failure㵭 in cooling
circuit if the results are the same.
㩷
ON
䋨Set temp+0.6㷄䋩
Chamber temp
OFF
(Set temp-0.6㷄)
Diagnosis OFF
(Set temp-2.0㷄)
Comp 䌁
Comp 䌂
of
of
on
on
of
of
on
on
㽳Pull-up time
㰱㪫㪈
㽳Pull-up time
㰱䌔㪉
of
on
㽴Diagnosis period
㩿Ʀ㪫㪈㪂Ʀ㪫㪉㪀㪆㪉×㪈㪅㪈
㽲Diagnosis point
㪸
㪹
㪺