28 / 37
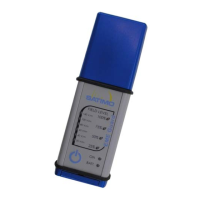
Figure 27 : Selection of Zoom zone
Release the mouse. The graph shows the field values between the two selected samples.
Figure 28 : Monitoring Graph after Zoom
All the display functions described for a graph in normal mode are also available in zoom
mode.
To go back to the initial display, position the mouse in the graph and with a right click,
drag the cursor to the left, then release.
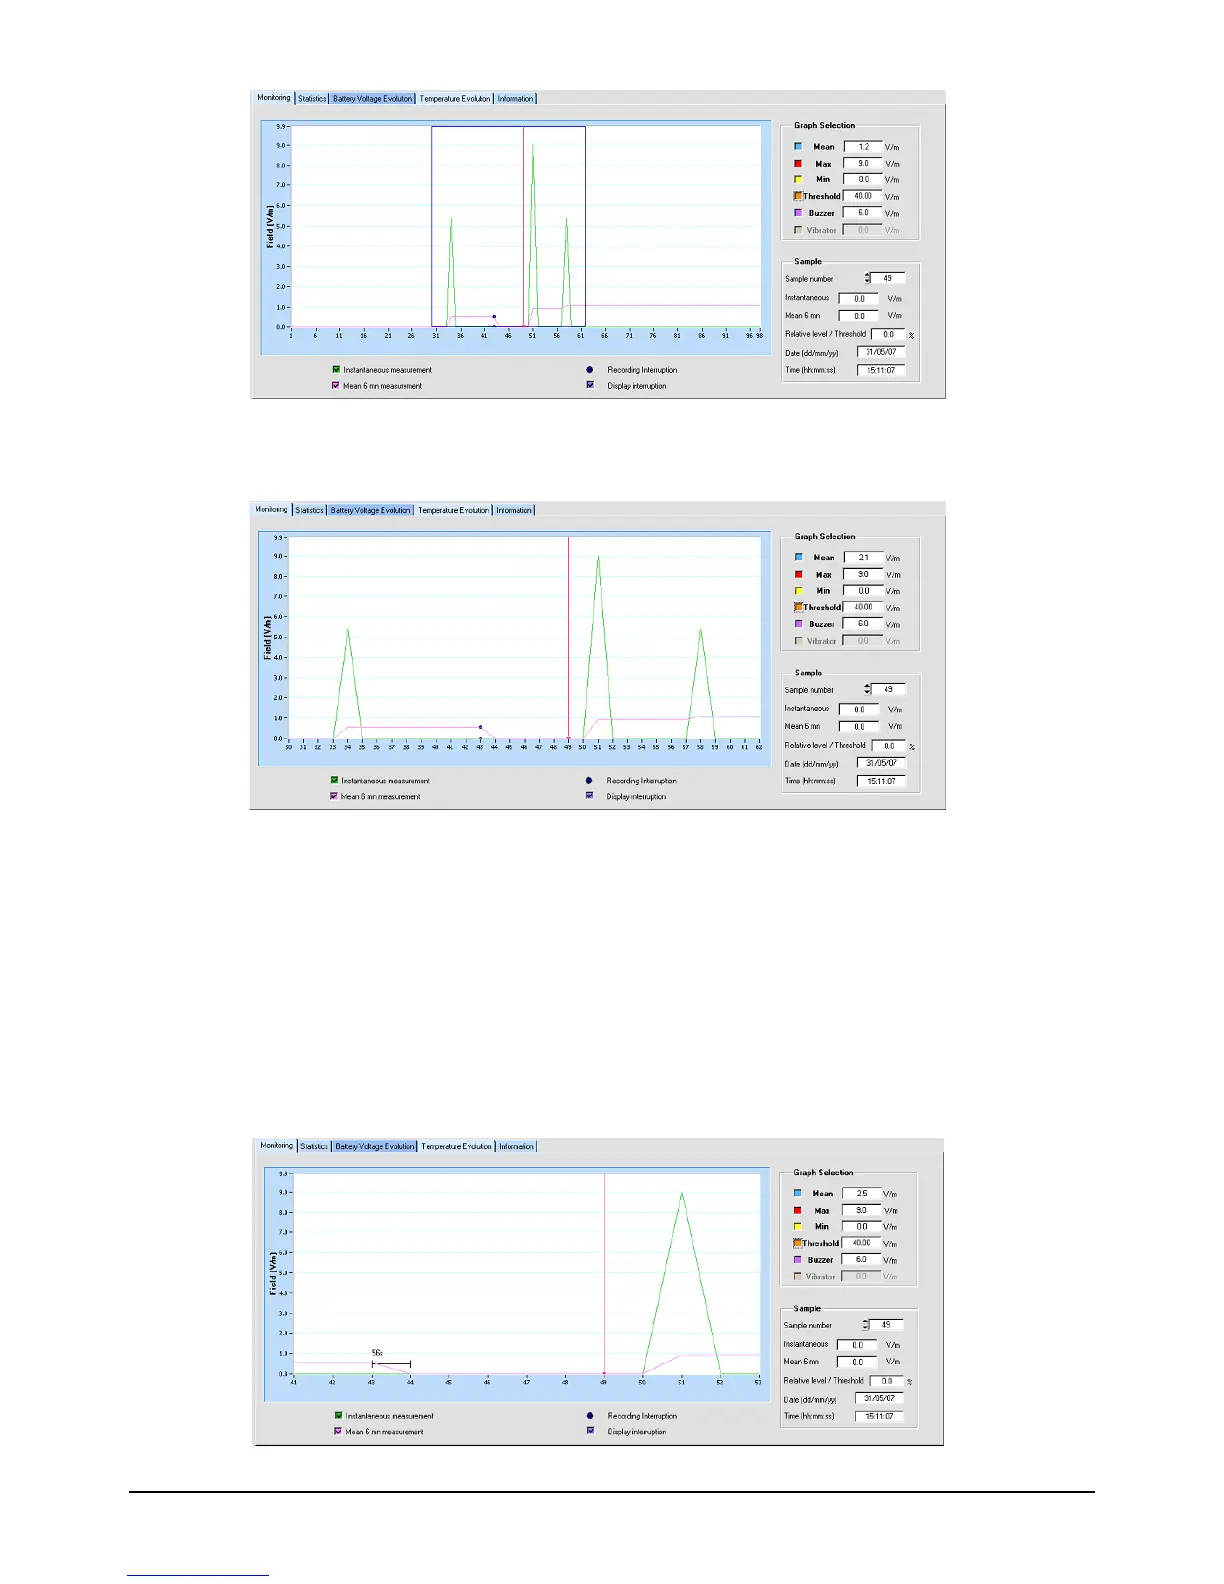
• Display recording cycle interruptions:
Any interruptions in the recording cycle are indicated on the Monitoring graph by dark blue
circles. To display the length of interruption, zoom in with a window width of less than 30
samples.
Figure 29 : Length of interruption display