SEL-2414 Data Sheet Schweitzer Engineering Laboratories, Inc.
4
Analyze Transformer Sequence-of-Events
Record sequence-of-events related to transformer events or operations with the Sequential Events Recorder (SER)
function. With this function, you can analyze assertions and deassertions of digital inputs and outputs; as many as 512
state changes to the millisecond for as many as 96 different digital points. The function also captures when the device
powers up and a settings change occurs.
Figure 3 Example SER Report
Analyze Transformer Event
Waveforms
Record analog and digital waveforms at 32 samples/cycle for
as many as 64 power system cycles, approximately 1 s. Use
the event report to move the oscillographic data to your PC.
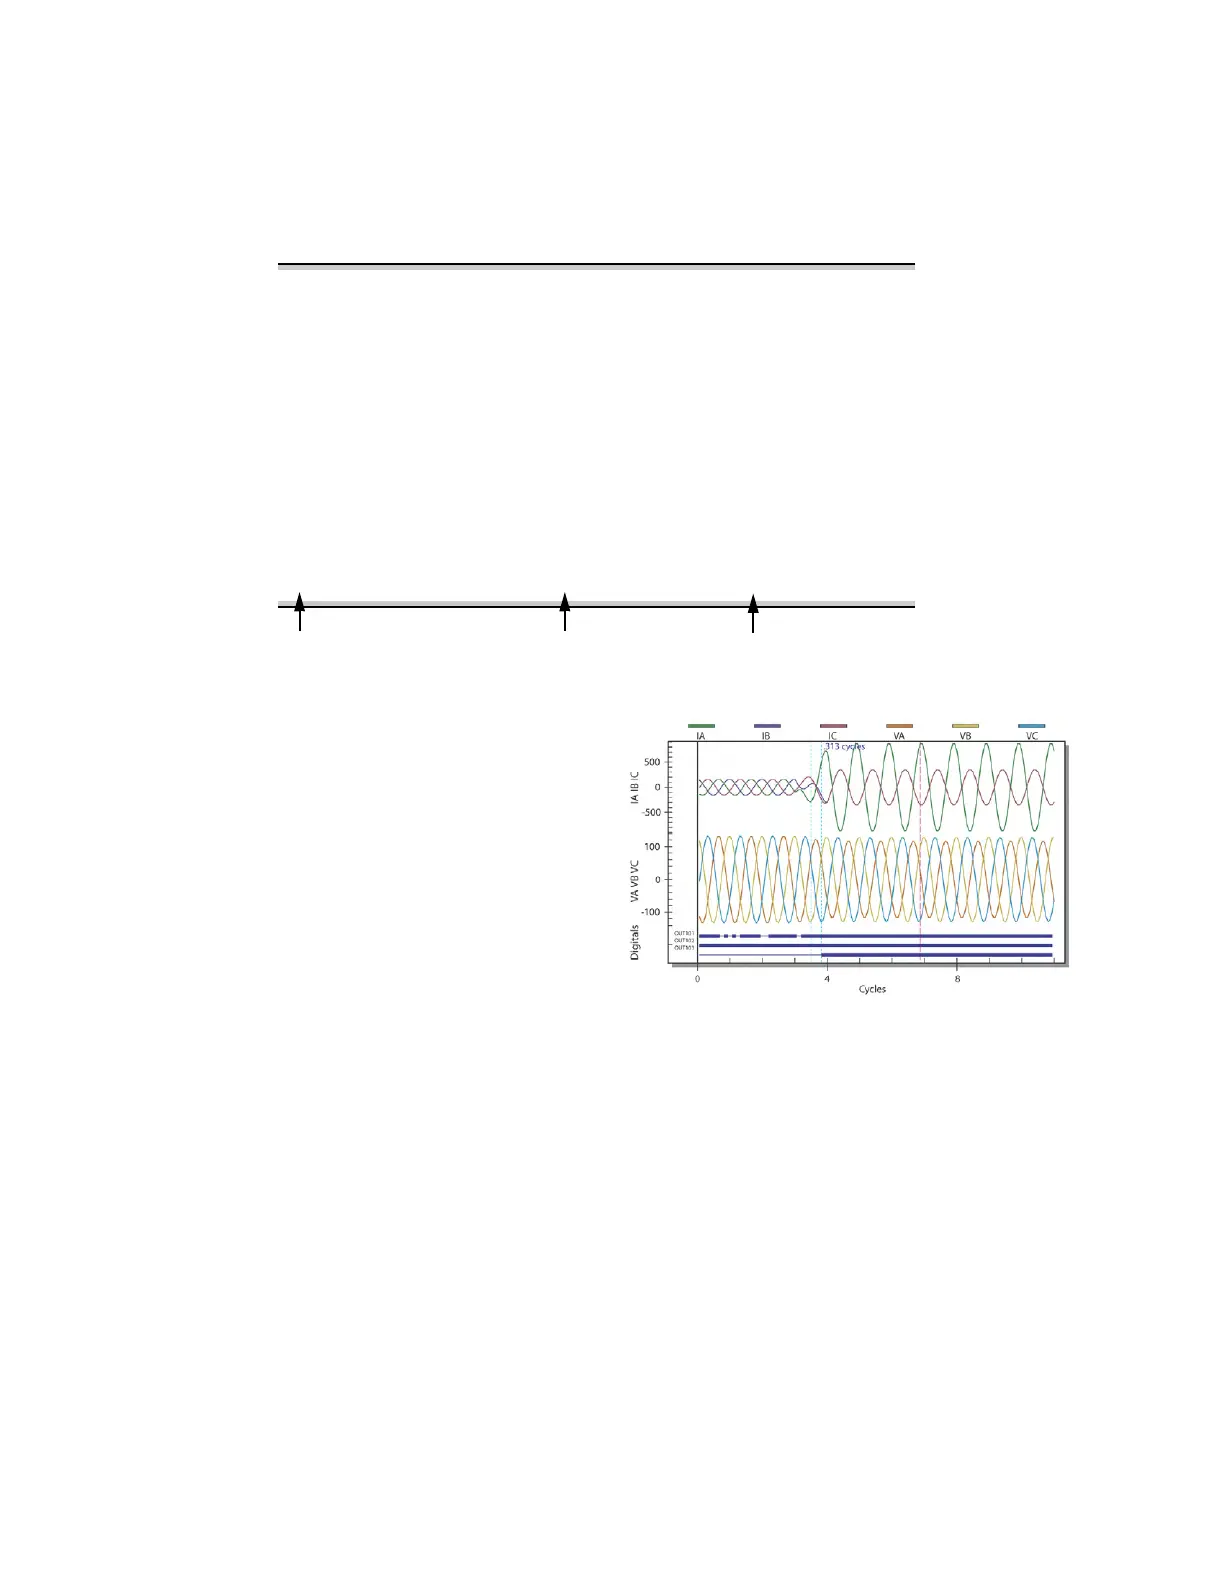
You can plot your event report data with the SEL-5601-2
SYNCHROWAVE
®
Event Software or with Microsoft Excel.
Event reports contain ac currents, ac voltages, and digital
inputs and outputs. The report automatically adjusts
content to the I/O cards you use. Reports are stored in
nonvolatile memory to protect your data even if power is
lost. Event reports are optimized for recording power
disturbances and relating them to your process.
Set the report to capture either 15 or 64 power system
cycles of data around the trigger event. For a 60 Hz
system, the event report lengths are 0.25 s and 1.07 s. For
a 50 Hz system, the report lengths are 0.30 s and 1.28 s.
Figure 4 Example SYNCHROWAVE Event Waveform Plot
Trend Transformer Temperatures
and Other Analog Inputs
Record measured ambient, transformer top-oil, trans-
former hot-spot and other analog data (measured or cal-
culated) for trending with the Analog Signal Profile
function. This profile (trending) function can track as
many as 32 analog channels. The function records the
magnitude and time of acquisition of each analog chan-
nel. Use the profile report to move trend records to your
PC and quickly plot the data with Microsoft Excel or any
other spreadsheet application.
SEL-2414 Date: 04/03/2005 Time: 07:21:19
DEVICE
# DATE TIME ELEMENT STATE
17 04/03/2005 06:25:51.120 RB01 Deasserted
16 04/03/2005 06:25:51.125 OUT102 Deasserted
15 04/03/2005 06:26:03.049 RB01 Asserted
14 04/03/2005 06:26:03.053 OUT102 Asserted
13 04/03/2005 06:51:17.748 Device Powered Up
12 04/03/2005 06:51:20.361 OUT101 Asserted
11 04/03/2005 06:51:21.366 OUT101 Deasserted
10 04/03/2005 06:54:10.753 Device Settings Changed
9 04/03/2005 06:54:10.762 FAN BANK #2 OFF Asserted
8 04/03/2005 06:54:11.737 OUT101 Deasserted
7 04/03/2005 07:06:01.739 FAN BANK #2 ON Asserted
6 04/03/2005 07:06:02.744 OUT101 Deasserted
5 04/03/2005 07:06:14.993 Device Settings Changed
4 04/03/2005 07:06:15.002 OUT101 Asserted
3 04/03/2005 07:06:15.977 FAN BANK #1 ON Deasserted
2 04/03/2005 07:13:22.947 OUT101 Asserted
1 04/03/2005 07:13:23.951 OUT101 Deasserted
SER Number
Element or Condition
Element State
 Loading...